Between listening sessions, cabled were switched.
Each monthly issue of Stereophile
includes an updated calendar of all the different hi-fi events taking place across the United States. We also maintain this calendar on our Facebook Events page. One of the events that really caught our eye was the Blind Cable Comparison Tests performed by the Audio Society of Minnesota, which took place on Tuesday, April 17th. Here is the report as submitted by members of the Audio Society of Minnesota. The Society reported record crowds for this event. Hopefully, this spirit of questioning, discovery, and fun will spread to other audio events across the country
The Tests
The questions have vexed audiophiles for decades: Do speaker cables make a difference? Are expensive cables better than cheap cables? The Audio Society of Minnesota tackled these questions with a little experiment involving over 50 members and guests as our test group. As much as was possible under the circumstances, the experiment was set up as a blind test of four sets of cables (A, B, C, & D) ranging from cheap to expensive and tested in pair sets in the order shown below.
Test 1: A & B
Test 2: C & D
Test 3: B & D
Test 4: C & A
Test 5: B & C
Test 6: D & A
Test 7: A & C
Test 7 is a repeat of test 4 except that the order of cables was reversed.
Cable “A” was a 7ft pair of common 16ga zipcord terminated with hardware store copper spades. Approximate cost: less than $3.
Cable “B” was 6ft pair hollow tube design wrapped with an exotic copper winding and terminated with copper spades. Retail price in the $8000 range.
Cable “C” was a 15ft heavy gauge, complex twisted pair in rubber plenum terminated with gold plated copper spades. Price $1,200.
Cable “D” was a 6ft prototype silver cable in a Teflon jacket, 18ga twisted. Bare wire ends coated with solder. Price to be determined, but well over $1,000.
Blind tests were performed. The audience did not know how many cables were involved in testing. Cables were kept hidden behind the speakers and amplifiers. Preamp and amplifier levels were not adjusted during the tests or between tests. Seven separate listening tests pitted one unknown cable pair against a second unknown cable pair. The same 1 minute 50 second listening track consisting of various music selections was used in every test.
To assure proper connection between the amp and speakers, the listening began with a phase test, an “out of phase” male voice followed by an “in phase” voice. These short few seconds were taken from a
Stereophile Test CD. The 5 second phase test was immediately followed by the opening 38 seconds of the “Firebird Suite” from the Reference Recordings Sampler with the Minnesota Orchestra with a short fade out. This was followed by 34 seconds of the beginning of Mark Knopfler’s “Shangri-La” from the same titled album, again with a short fade out. This was followed immediately by 33 seconds of Tracy Kent’s rendition of “You’re the Top”. This mix of music features demanding peaks from the Firebird, a well recorded male vocal and background, and a well recorded female vocal with Jazz trio and piano solo. Track mix was performed using Pro Tools and burned to disc in various formats. After private disc listening comparisons, the decision was made that the DVD-A 24/96 format was most faithful to the original track selections and was used for the tests.
For each of the seven comparison tests, the music track was played using the first pair of speaker cables, a pause for cable switching (20 to 35 seconds), followed by the same track using the second pair, followed by cable switching, followed by a music track using the first pair a second time, more cable switching, then the second pair a second time.
After two repetitions of cable switching, test #1 concluded and the audience was asked to mark sheets with votes indicating the listener’s preferred cable. They were asked to rate the cables on bass, midrange, treble, and overall preference. An option was also given to indicate a “no preference” vote in each of the categories. The audience was informed that cable “winners” would only be based on the “overall” preference votes. The remaining six tests were conducted in the same fashion. There was a 10min stretch break following Test 4.
Of the approximately 55 people in attendance, 40 submitted voting sheets. In addition to voting on listening tests, the audience was asked to answer a short questionnaire on the same sheet. After test Seven was complete, voting sheets were collected and the audience was then shown the four different sets of cables involved in all of the tests. While votes were being tallied, capacitance measurements and frequency response measurements were conducted on each of the cables under test.
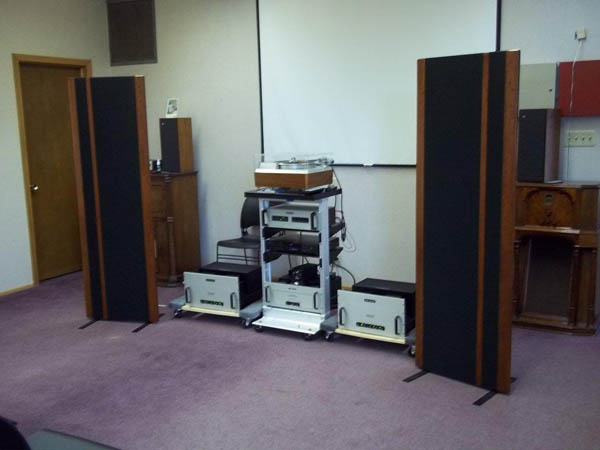
The room used for this event is in the ASM’s usual meeting venue, the Pavek Museum of Broadcasting. It is approximately 20ft wide, 38ft deep, and 10ft high, rectangular in shape with an open L-shaped area at the rear on the left channel side. It features a tight woven commercial carpet floor, an acoustic panel ceiling, and hard plaster walls. Windows along the right channel wall are covered in aluminum blinds. Speakers were positioned 8ft apart at their center and 5ft from the back wall with ribbon tweeters on the outside, toed in to converge about 12ft into the room. An equipment rack was centered between speakers. Two “cable changers” were placed behind the speakers and equipment. The first row of listeners was approximately 7ft from speakers.
The Audio Society of Minnesota/Pavek Museum house system consists of a modified/upgraded Oppo BDP-83 multi format player with analog stereo output into an ARC SP-17 preamplifier feeding two ARC M-300 mono power amplifiers.
 Full Disclosure
As guided by “Murphy’s Law”, one of the two M-300 MkII amps blew a fuse early during test #3. Rather than attempting to determine the cause of the failure, it was decided to switch to a back-up amplifier, an ARC D-115MkII. This created a 15 minute downtime period followed by several quick attempts to adjust levels and balance to match that of prior tests. The second half of test #3 and all remaining tests were done using this second amplifier.
There were several comments to the effect that the sonics of the second amplifier, which was slightly preferred. Hopefully this did not significantly influence the results of test #3 and remaining tests.
Interconnects were Anti-Cables while the speakers were Magnepan 3.6. Connections on both speakers and amps are stock screw down block terminals. Because of this, we preferred to use cables of spade terminations for easiest installation and changing without the use of any adaptors on terminations. Cables were kept hidden from view at all times.
The Results
So what did we find? Do cables make a difference and are expensive cables better than cheap ones? Looking at the proportion of votes for the cable pairs does indicate that some cables were preferred over others.

(At this point, all 4 cables have been tested against one another – each being involved in three tests.)
Test #7: A & C:
C: 49%
A: 41%
No Preference: 11%
As noted earlier, test #7 is a repeat of test #4, except order of cables is reversed. It is interesting to note that even though cable order was reversed, results came out nearly the same.
Here’s another way of looking at the results:
Cable C: 3 wins, 0 losses
Cable D: 2 wins, 1 loss
Cable B: 1 win, 2 losses
Cable A: 0 wins, 3 losses
The win loss records represent a clear ranking in that no cable defeated a cable ranked higher than itself.
Of all Votes that noted a cable preference (all first 6 tests combined) results are:

This shows that listener votes of “preferred cable” align more with Mids and Highs preference than with Bass response preference.
 Questionnaire Results:
55% of voting audience uses bulk wire (not branded) on their home systems. Of those that use branded cables, 72% cost $500 or less per set in retail dollars. Therefore, 13% of audience use “expensive cables”, 33% use branded cables $500 or less.
Before this test 69% of our test subjects thought that speaker cables could make a significant difference. After this test, 86% believe that speaker cables can make significant differences.
Since no statistical tests of significance have been applied to the results it is not possible to demonstrate that one set of cables was found to be superior to any others in an objective sense. Subjectively, however, it was shown that cable C received more preference votes than the others with cable D, the prototype silver/Teflon, running in second place. Cable B fell more or less in the middle of the rankings. Cable A, the zipcord, was not preferred on any of the three comparison tests in which it was included, suggesting that, yes, these cheap and commonly used cables do not sound as good as cables designed for the audiophile market.
Based on the results of this informal but honest attempt to address the questions posed earlier, it does appear that in this case at least, there was a preference for the expensive cables and a definite non-preference for the cheap zipcord. So cables do make a difference.
Next stop…interconnects!
Observations
Points of Interest regarding Voting:
- As a group, those who use bulk wire as cabling liked the bulk wire (A) the least.
- As a group, those who owned expensive (not bulk) cabling favored the cheap bulk wire (A) over the most expensive cable (B).
- As a group, those who owned brand named cabling (not bulk) were less likely to cast a "non-preferred" vote.
- As a group, those who sat in a more ideal room location were more likely to vote alike.
For this grouping in test #3, cable (B) received zero preferred votes. For this same grouping in test #4, cable (A) received zero votes.
- Cables listened to as #2 and #4 in order of each test, received slightly more preferred votes.
Yet, the most popular cable (C) was first/third in order in two of three tests.
All listener comments (in regards to cables) that were written onto the voting sheets:
- One listener wrote that their favorite two cables were #2 from test #2, and #2 from test #3. This was cable D in each case.
- One listener wrote that their favorite cable was #2 from test #7, and second choice was #1 from test #2. This was cable C in each case.
- One listener wrote that the worst cable was #1 (A) from test #7, where the least popular cable was compared to the most popular cable.
- One listener wrote asking if cable #1 from test #6 (D) was the same as cable #2 from test #7 (C), the two most popular cables.
No other listeners made guesses or comments regarding which cables were their most or least favorite.
Does this imply that those who cared to comment, had golden ears?
Points of Interest Regarding the Questionnaire:
- Seven listeners initially indicated that speaker cables do not make a significant difference, then changed their decision after the test.
- One listener initially indicated that speaker cables do make a significant difference, then changed that decision after the test.
- The term “significant difference” was left open for interpretation.
Measurements

This graph shows the transfer function magnitude (frequency response) of each cable. Order of the cables from top to bottom is B, C, A, then D.
The measurements represent the transfer function of the cables only. The reference probe was attached to the amplifier output and the measure probe was attached at the speaker input. The cables were measured with an MLS signal using Speaker Workshop with a Roland UA-1EX sound interface at a 48kHz sample rate. A signal length was chosen to give ~1.5Hz resolution. Some of the measurements had artifacts at 60 or 120Hz, these were removed for this graph, and the measurements were 1/6 octave smoothed.
The Impedance of the Magnepan 3.6R was measured and found to be largely resistive with a value ~4.6-4.7 ohms except for a large peak of about 85 ohms centered at approximately 560Hz.
Credits
Don Meger was the principal writer of the articles and test procedures. Gene Lyle assisted with the editing and final drafts of the articles. Ron Ennenga did the frequency response measurements and graphs on the cables. Frank Van Alstine provides the capacitance measurements.