Sidebar 3: Measurements
I measured AVM's Inspiration CS 2.3 using my Audio Precision SYS2722 system,1controlling the amplifier with the AVM RC X app on my iPad mini. As the AVM is a class-D design, and class-D amplifiers emit relatively high levels of ultrasonic noise that would drive the analyzer's input into slew-rate limiting, all the measurements other than frequency response were taken with Audio Precision's auxiliary AUX-0025 passive low-pass filter. (The AUX-0025 mitigates noise above 80kHz and eliminates noise above 200kHz.) Without the filter, there was approximately 400mV of ultrasonic noise with a center frequency of 400kHz present at the loudspeaker terminals.
Looking first at the single-ended analog line inputs: With the AVM's Input Gain set to "0dB," the volume control set to its maximum—the control operates in accurate 0.5dB steps—and the tone controls bypassed, the voltage gain at 1kHz into 8 ohms measured 48.1dB at the speaker terminals, 22.2dB at the headphone output, and 18.3dB at the preamplifier output. The line input preserved absolute polarity (ie, was noninverting) from all three output types, and the input impedance was low—the specified 3.44k ohms—at all audioband frequencies.


With the volume control set to its maximum, a 1kHz digital signal at –30dBFS resulted in an output level of 14.56V into 8 ohms from the loudspeaker output, which is just 6.75dB below the clipping voltage. Reducing the Input Gain by the maximum 9.5dB will still result in the CS 2.3 speaker outputs clipping with full-scale data and the volume control set above –14dB. With the Input Gain set to "0dB," data at –20dBFS gave maximum levels of 3.32V from the headphone output and 2.12V from the preamplifier output. As with the phono input testing, I measured the digital inputs' behavior at the preamplifier output with the speaker outputs turned off and the volume control set to –10dB. (The preamplifier output clipped with the control set to –8dB.)


AVM's CS 2.3 amplifier offers generally excellent measured performance, though it will probably work best with speakers that have an impedance greater than 4 ohms. The phono input offers low noise and distortion and accurate RIAA equalization; the digital inputs offer high resolution; and the CD transport offers one of the best error correction/concealment performances I have encountered. The only thing that raised my eyebrows was the digital inputs' excessive gain.—John Atkinson
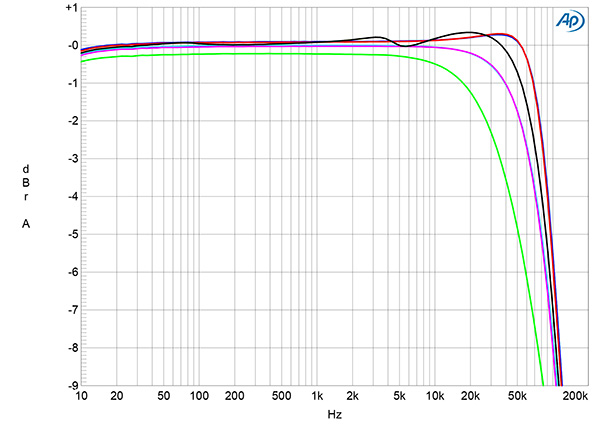
Fig.1 AVM Inspiration CS2.3, line input, frequency response at 2.83V into: simulated loudspeaker load (gray), 8 ohms (left channel blue, right red), 4 ohms (left cyan, right magenta), 2 ohms (green) (1dB/vertical div.).
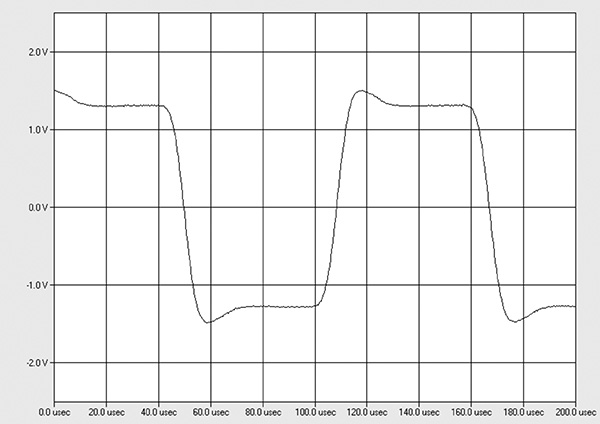
Fig.2 AVM Inspiration CS2.3, line input, small-signal, 1kHz squarewave into 8 ohms.
The preamplifier output impedance was 297 ohms from 20Hz to 20kHz; that at the headphone output was 48 ohms, again from 20Hz to 20kHz. The CS 2.3's output impedance at the speaker terminals was very low at 20Hz and 1kHz, at 0.09 ohm, rising to 0.35 ohm at 20kHz. (These values include the series resistance of 6' of spaced-pair speaker cable.) Consequently, the variation in frequency response with our standard simulated loudspeaker, taken without the AP low-pass filter (fig.1, gray trace), was minimal. This graph was taken with the volume control set to its maximum; the superb channel matching was preserved at lower settings of the control. Into 8 ohms (fig.1, blue and red traces), there is a slight rise in response above the audioband, which correlates with a critically damped overshoot on the waveform's leading edges with the CS 2.3's reproduction of a 10kHz squarewave into this load (fig.2).
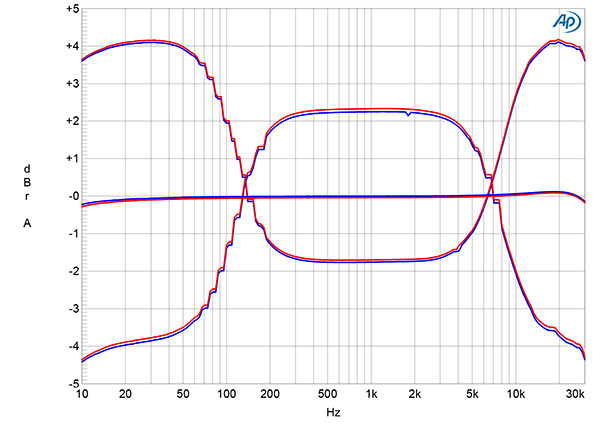
Fig.3 AVM Inspiration CS2.3, line input, frequency response at 2.83V into 8 ohms with Bass and Treble controls set to "+6dB" and "–6dB" (left channel blue, right red) (1dB/vertical div.).
Fig.3 shows the effect of the AVM's bass and treble controls set to their +6dB and –6dB positions. Both controls offer a range of ±6dB. However, as can be seen from this graph, compared with the level with the controls bypassed (central traces), they also change the level between 200Hz and 4kHz by +2.2dB when set to 6dB cut and by –1.8dB when set to 6dB boost. Channel separation was good rather than great, at 60dB R–L and 70dB L–R, both values consistent across the audioband.
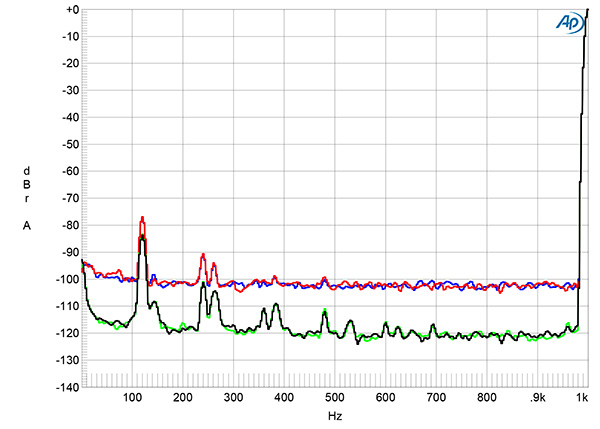
Fig.4 AVM Inspiration CS2.3, line input, spectrum of 1kHz sinewave, DC–1kHz, at 1W into 8 ohms with volume control set to the maximum (left channel blue, right red) and to –20dB (left cyan, right magenta) (linear frequency scale).
With the ultrasonic filter installed, the CS 2.3's line inputs shorted to ground, and the volume control set to the maximum, the wideband, unweighted signal/noise ratio (ref. 2.83V into 8 ohms) measured 64dB in both channels. Restricting the measurement bandwidth to 22kHz increased the ratio to 68dB, and an A-weighting filter increased it further, to 70.9dB. Spectral analysis of the AVM's low-frequency noisefloor (fig.4) revealed power-line–related AC spuriae at 120Hz and 240Hz. The blue and red traces in this graph were taken with the volume control set to its maximum; reducing the volume by 20dB (green, gray) dropped the level of the random noise by the same 20dB but only reduced the levels of the power supply spuriae by a little.
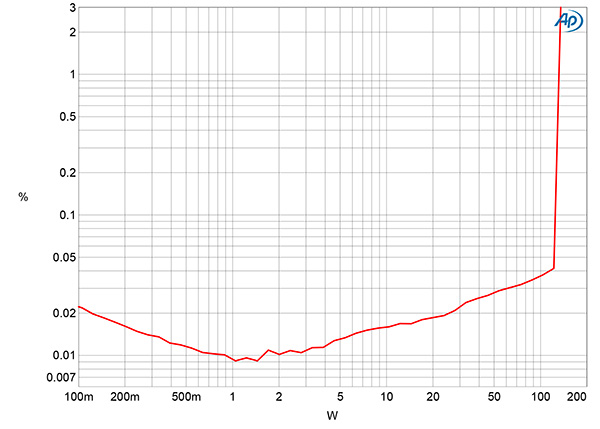
Fig.5 AVM Inspiration CS2.3, line input, THD+N (%) vs 1kHz continuous output power into 8 ohms.
Fig.6 AVM Inspiration CS2.3, line input, THD+N (%) vs 1kHz continuous output power into 4 ohms.
Fig.7 AVM Inspiration CS2.3, THD+N (%) vs frequency at 12.67V into: 8 ohms (left channel blue, right red), and 4 ohms (left green, right gray).
The CS 2.3 is specified as delivering a maximum output power of 140Wpc into 4 ohms (18.45dBW) at 1% THD+N, which is our usual definition of clipping. The CS 2.3 clipped at 125Wpc into 8 ohms (21dBW, fig.5) and at 140Wpc into 4 ohms (18.45dBW, fig.6), precisely meeting its specification. Distortion levels at 12.67V, equivalent to 20W into 8 ohms and 40W into 4 ohms (fig.7), were very low, though with the usual increase in the top two octaves, which will be due to corrective negative feedback decreasing as the frequency increases.
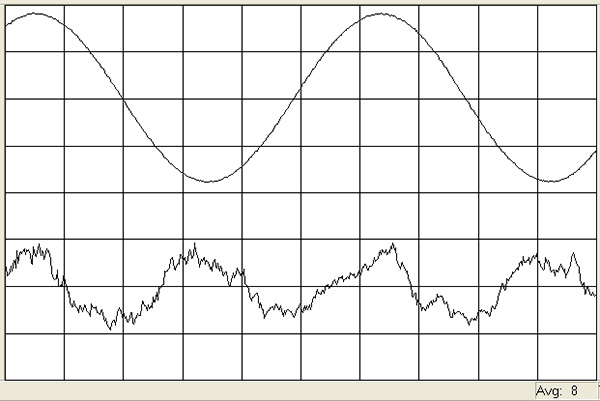
Fig.8 AVM Inspiration CS2.3, line input, 1kHz waveform at 50W into 8 ohms, 0.026% THD+N (top); distortion and noise waveform with fundamental notched out (bottom, not to scale).
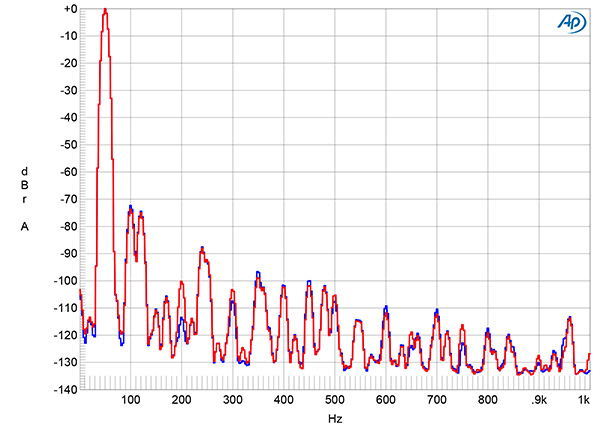
Fig.9 AVM Inspiration CS2.3, line input, spectrum of 50Hz sinewave, DC–1kHz, at 50Wpc into 8 ohms (left channel blue, right red; linear frequency scale).
Fig.10 AVM Inspiration CS2.3, line input, HF intermodulation spectrum, DC–30kHz, 19+20kHz at 50Wpc peak into 4 ohms (left channel blue, right red; linear frequency scale).
The distortion signature appears to be primarily second harmonic in nature (fig.8) and low in level at –74dB (0.02%, fig.9), though the supply-related spurious tone at 120Hz was close to the same level. Intermodulation distortion was also very low: Even into 4 ohms (fig.10), the difference product at 1kHz lay at –79dB (0.01%).
Turning to the AVM's phono input, I connected a wire from the Audio Precision's ground terminal to the grounding lug on the AVM's rear panel to obtain the lowest noise. This input preserved absolute polarity at all three outputs in both MM and MC modes. Without any loading resistors, the input impedance measured 45k ohms at 20Hz and 1kHz, dropping slightly to 34k ohms at 20kHz. With the 1000 ohm loading resistors, the impedance measured 979 ohms across the audioband; with the 200 ohm resistors, it was 199 ohms; and with the 100 ohm resistors, it was exactly 100 ohms.
In MM mode, the maximum gain at 1kHz was 58.56dB at the Pre output, 62.35dB at the headphone output, and a very high 88.4dB at the loudspeaker outputs. The gains in MC mode were around 20dB higher. To avoid clipping the output stages, I turned off the speaker outputs and performed all the subsequent testing using the preamp output with the volume control set to –10dB.
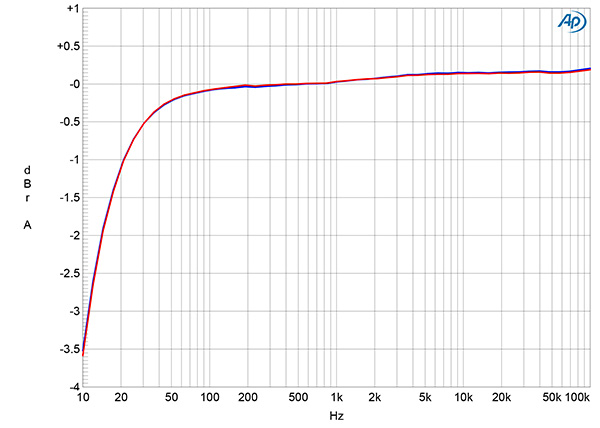
Fig.11 AVM Inspiration CS2.3, phono input, response with RIAA correction (left channel blue, right red) (0.5dB/vertical div.).
The phono input's RIAA correction (fig.11) was superbly accurate, but with a rolloff in the low bass reaching –3dB just above 10Hz. The wideband, unweighted S/N ratio in MM mode with the inputs shorted to ground was a very good 69dB in both channels, ref. 1kHz at 5mV. Restricting the measurement bandwidth to the audioband increased the ratio to 74dB, while an A-weighting filter further increased the ratio to 79dB. These ratios were all 4–5dB lower in MC mode, ref. 1kHz at 500µV, but this is still a low level of noise.
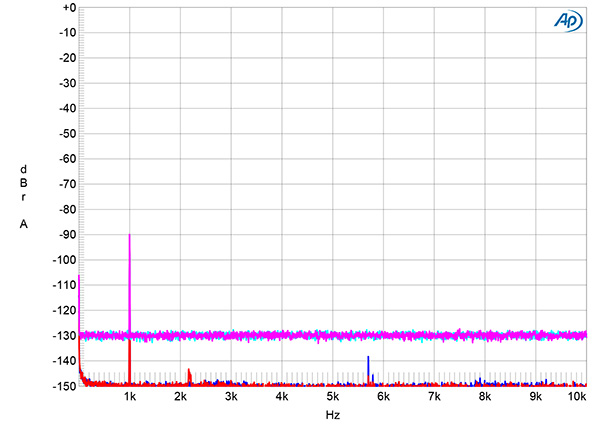
Fig.12 AVM Inspiration CS2.3, phono input, spectrum of 1kHz sinewave, DC–10kHz, for 17.5mV input (left channel blue, right red, linear frequency scale).
Fig.13 AVM Inspiration CS2.3, phono input, HF intermodulation spectrum, DC–30kHz, 19+20kHz at 145mV input (left channel blue, right red; linear frequency scale).
The phono input's overload margins in MM mode, ref. 1kHz at 5mV, were relatively high at 15–17dB from 20Hz to 20kHz. In MC mode, ref. 1kHz at 500µV, the margins at 20Hz and 1kHz were the same as in MM mode, but the 20kHz margin was a little lower, at 10.4dB. With a 1kHz signal at an input level 6dB below the overload voltage, the phono input's distortion signature was an equal mix of second and third harmonics, both lying at a very low –100dB (0.001%, fig.12). The level of the 1kHz difference product with an equal mix of 19 and 20kHz tones was also very low, at –80dB (0.01%, fig.13).
To examine the performance of the CS 2.3's digital inputs, I used the Audio Precision's optical and coaxial S/PDIF outputs, as well as playing test signals on a CD-R. The optical input locked to datastreams with a sample rate up to 96kHz; the coaxial input locked to 192kHz data. The CD transport offered superb error correction. Playing the Pierre Verany Test CD, there were no audible glitches until a single 4mm gap or two successive 3mm gaps in the data spiral. (The Compact Disc standard requires only that a player cope with gaps of up to 0.2mm.)
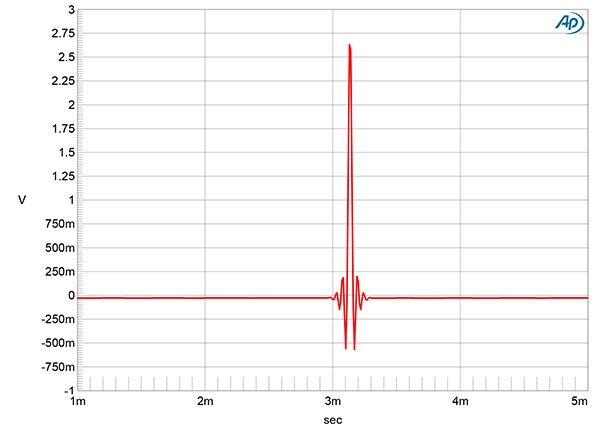
Fig.14 AVM Inspiration CS2.3, CD data, "Smooth" filter, impulse response (one sample at 0dBFS, 44.1kHz sampling, 4ms time window).
Fig.15 AVM Inspiration CS2.3, CD data, "Steep" filter, impulse response (one sample at 0dBFS, 44.1kHz sampling, 4ms time window).
The AVM's impulse response with CD data and the reconstruction filter set to "Smooth" (fig.14) indicates that this reconstruction filter is a very short linear-phase type, with a small amount of time-symmetrical ringing on either side of the single sample at 0dBFS. The "Steep" filter was also a linear-phase type but with more ringing (fig.15).
Fig.16 AVM Inspiration CS2.3, CD data, "Smooth" filter, wideband spectrum of white noise at –4dBFS (left channel red, right magenta) and 19.1kHz tone at 0dBFS (left blue, right cyan), with data sampled at 44.1kHz (20dB/vertical div.).
Fig.17 AVM Inspiration CS2.3, CD data, "Steep" filter, wideband spectrum of white noise at –4dBFS (left channel red, right magenta) and 19.1kHz tone at 0dBFS (left blue, right cyan), with data sampled at 44.1kHz (20dB/vertical div.).
With 44.1kHz-sampled white noise (fig.16, red and magenta traces), the CS 2.3's "Smooth" filter response starts to roll off at 16kHz but doesn't reach full stop-band suppression until 28kHz. An aliased image at 25kHz of a full-scale tone at 19.1kHz (blue and cyan traces) can be seen at –27dB, though the distortion harmonics of the 19.1kHz tone are all very low in level, at close to –100dB (0.001%). By contrast, the "Steep" filter rolled off rapidly above 20kHz, reaching full stopband attenuation at 24kHz (fig.17). When I examined the "Steep" filter's digital frequency response with S/PDIF data at 44.1, 96, and 192kHz (not shown), the response at all three rates started to roll off below half of each sample rate with the expected steep slope.
Fig.18 AVM Inspiration CS2.3, digital input, spectrum with noise and spuriae of dithered 1kHz tone at –90dBFS with: 16-bit data (left channel cyan, right magenta), 24-bit data (left blue, right red) (20dB/vertical div.).
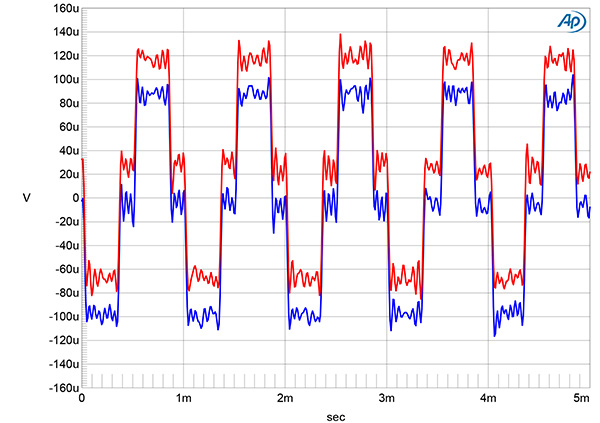
Fig.19 AVM Inspiration CS2.3, digital input, waveform of undithered 16-bit, 1kHz sinewave at –90.31dBFS (left channel blue, right red).
Increasing the bit depth from 16 to 24 with a dithered 1kHz tone at –90dBFS lowered the noisefloor by 20dB (fig.18), meaning that the CS 2.3 offers between 18 and 19 bits' worth of resolution. With undithered data representing a tone at exactly –90.31dBFS (fig.19), the three DC voltage levels described by the data were well resolved and the waveform was perfectly symmetrical. With undithered 24-bit data, the result was a clean sinewave (not shown).
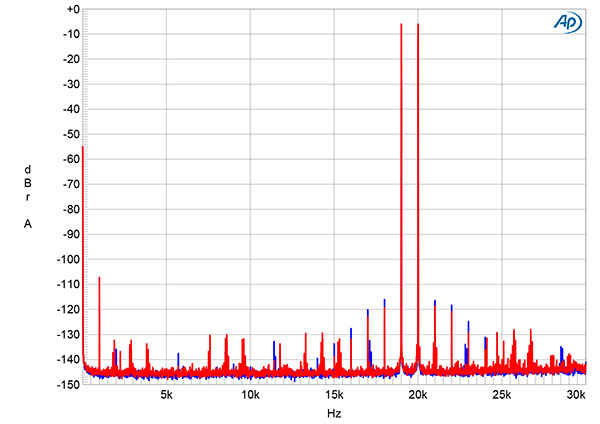
Fig.20 AVM Inspiration CS2.3, digital input, "Smooth" filter. HF intermodulation spectrum, DC–30kHz, 19+20kHz at 0dBFS peak, sampled at 44.1kHz.
The second-order intermodulation product at 1kHz with an equal mix of 19 and 20kHz tones with a peak level of 0dBFS lay at a very low –108dB (0.0004%, fig.20), and the higher-order products at 18kHz and 21kHz were 10dB lower in level. Peculiarly, and conflicting with the spectrum of the 19.1kHz tone shown in fig.16, no aliased images of the primary tones are present in this graph. (Fig.16 was taken with CD data, fig.20 with optical S/PDIF data.)
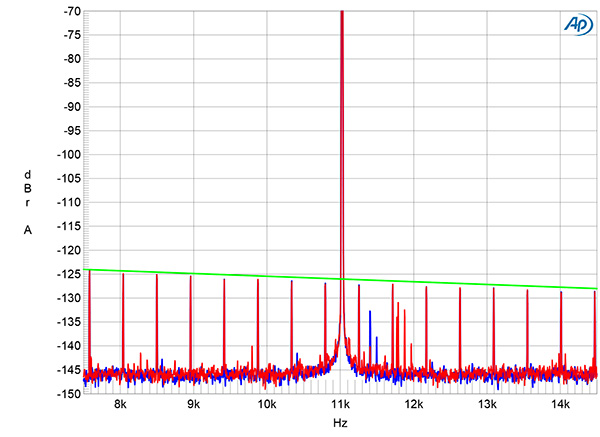
Fig.21 AVM Inspiration CS2.3, digital input, high-resolution jitter spectrum of analog output signal, 11.025kHz at –6dBFS, sampled at 44.1kHz with LSB toggled at 229Hz: 16-bit TosLink data (left channel blue, right red). Center frequency of trace, 11.025kHz; frequency range, ±3.5kHz.
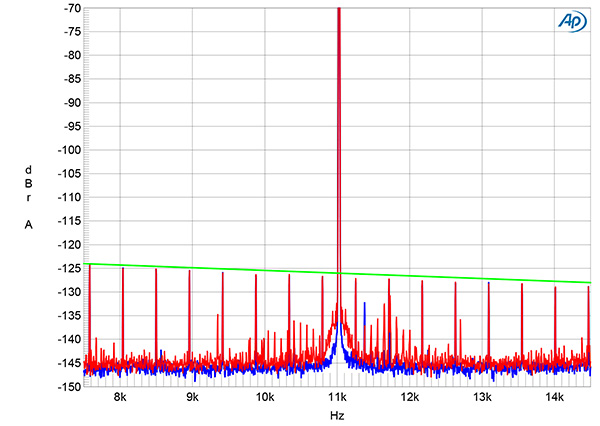
Fig.22 AVM Inspiration CS2.3, high-resolution jitter spectrum of analog output signal, 11.025kHz at –6dBFS, sampled at 44.1kHz with LSB toggled at 229Hz: 16-bit CD data (left channel blue, right red). Center frequency of trace, 11.025kHz; frequency range, ±3.5kHz.
The AVM's rejection of word-clock jitter with 16-bit TosLink data (fig.21) was superb, with all the odd-order harmonics of the LSB-level, low-frequency squarewave at the correct levels, indicated by the sloping green line in this graph. Repeating the analysis with 16-bit CD data (fig.22) gave a very similar result.