Sidebar 4: Measurements
A full set of measurements for the Ayre K-3 were made in its balanced configuration, with selected measurements repeated for the unbalanced mode. Unless otherwise noted, the measurements presented are for balanced operation.
The Ayre's impedance at its line output measured 558 ohms at 1kHz in the left channel, 561 ohms in the right (279 ohms unbalanced, left channel), with insignificant variations with changes in the level control. The line-level input impedance measured 21k ohms (10k ohms unbalanced), again virtually independent of the level control. Phono input impedance as reviewed measured 55.8k ohms. The output impedance at the tape output was 1k ohm with a 25 ohm source impedance and just over 1.5k ohms with a 600 ohm source impedance, indicating unbuffered tape outputs.
The DC offset measured a very high 21.3mV in the left channel, a more acceptable 2.3mV in the right. Pin 2 is positive in the balanced configuration, but the preamp is inverting from its line inputs to its main outputs in unbalanced mode. The phono stage is similarly inverting from its balanced input to its unbalanced tape output, when the phono source is connected with pin 2 positive.
Line-stage voltage gain (CD input to line output) measured 16.3dB balanced, 10.3dB unbalanced. Phono gain measured 52.5dB. (All measurements were made with the phono stage at its standard, nominal 50dB, gain setting.) Volume-control tracking was excellent. S/N measured 92.4dB (unweighted) over a bandwidth of 22Hz–22kHz, 81.7dB unweighted from 10Hz to 500kHz, and 94.7dB A-weighted (all ref. 1V) for the line stage. The same readings for the phono stages were, respectively, 75dB, 67dB, and 88.5dB.
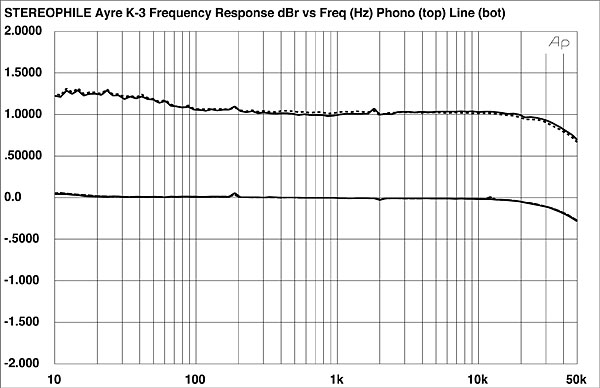
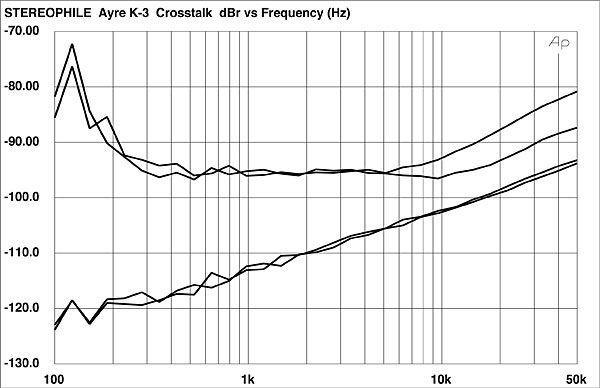
Except as noted, the line-stage measurements presented below were taken with a signal input of 500mV, with the level control set at a point that produced a gain of unity plus 6dB. The input used for the phono-stage measurements was 1mV. The Ayre K-3's frequency response is shown in fig.1. The slight low-frequency rise in the phono response is unlikely to be audible. The similarly excellent crosstalk results are shown in fig.2.
 Finally, the Ayre's phono overload margin was also very good: 1% THD+noise was reached at an input of 16mV (30.1dB) at 1kHz, 152mV (29.7dB) at 20kHz, and 1.6mV (30.1dB) at 20Hz—all very respectable figures.
Altogether, the Ayre K-3 turned in a first-rate set of measurements all down the line.—Thomas J. Norton
Finally, the Ayre's phono overload margin was also very good: 1% THD+noise was reached at an input of 16mV (30.1dB) at 1kHz, 152mV (29.7dB) at 20kHz, and 1.6mV (30.1dB) at 20Hz—all very respectable figures.
Altogether, the Ayre K-3 turned in a first-rate set of measurements all down the line.—Thomas J. Norton
Fig.1 Ayre K-3, frequency response at 500mV into 100k ohms, phono stage (top), line stage (bottom) (0.5dB/vertical div.).
Fig.2 Ayre K-3, crosstalk (from top to bottom): L–R, phono; R–L, phono; L–R, balanced line; R–L, balanced line (10dB/vertical div.)
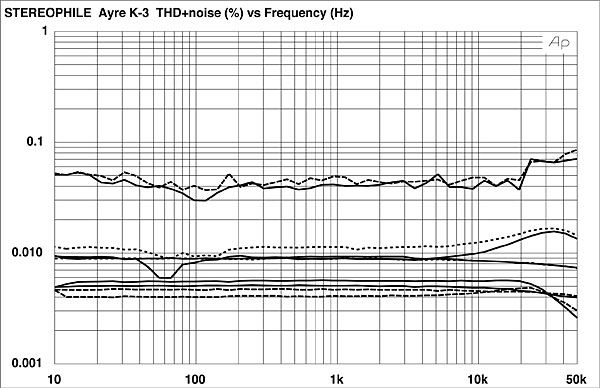
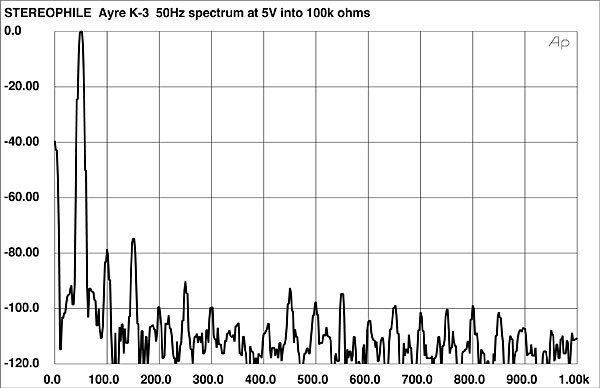
The THD+noise vs frequency for the Ayre is shown in fig.3. Again, the results require little comment. (Measured to minimize the noise component of the THD+noise, the reading for the line stage was 0.0045% at 1kHz with the level control at maximum and an input of 197mV. For the phono stage, the minimum noise reading was 0.016% at 1kHz and 2.5mV input.) The spectrum of the Ayre's output reproducing a 50Hz input at 5V into 100k ohms is shown in fig. 4. The second-harmonic distortion here is at –78.6dB (about 0.012%), the third-harmonic at –74.9dB (about 0.02%). Increasing the output to 10V (graph not shown) increases these values to –72.4dB (about 0.025%, second harmonic) and –59.7dB (about 0.1%, third harmonic).
Fig.3 Ayre K-3, THD+noise into 100k ohms vs frequency at 197mV input (line, bottom) and 2.5mV input (phono, top).
Fig.4 Ayre K-3, spectrum of 50Hz sinewave, DC–1kHz, at 5V into 100k ohms (linear frequency scale).
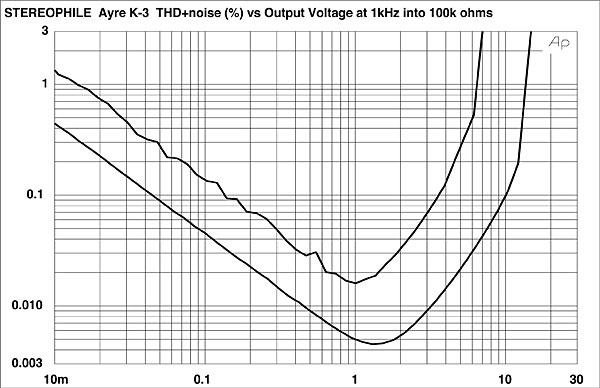
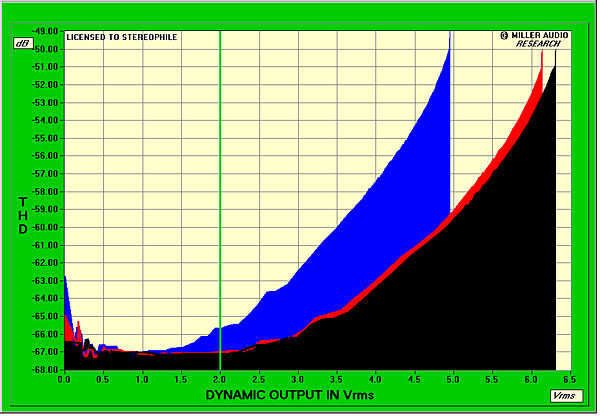
How the THD+noise percentage varies with output voltage at 1kHz is shown in fig.5. The preamp clips at a level well above that required to fully drive a power amplifier. This is for a continuous 1kHz tone into a high 100k ohms load. Substituting a 1kHz toneburst signal, and using the Miller Audio Research Amplifier Profiler to explore the preamp's output envelope a little more closely, gave the curves shown in fig.6. The black trace is the output THD (plotted in dB) into 100k ohms as in fig.5. The red trace shows what happens when the load is reduced to 10k ohms, typical of many solid-state power amplifiers. There is slight more distortion present at high output voltages, but to the left of the vertical green line at 2V, which is the highest voltage the K-3 will be asked to deliver, the difference is negligible. Only into a punishing 1000 ohms (blue trace) did the K-3 start to sweat a little but even then, this was only significant above 2V.
Fig.5 Ayre K-3, distortion (%) vs output voltage into 100k ohms: phono (top) and line (bottom).
Fig.6 Ayre K-3, distortion (%) vs output voltage into 100k ohms (black), 10k ohms (red) and 1000 ohms (blue), 1kHz toneburst (10 cycles on, 40 cycles off).