| Columns Retired Columns & Blogs |
I think we can all agree that some T+A is good from time to time. I'll see myself out.
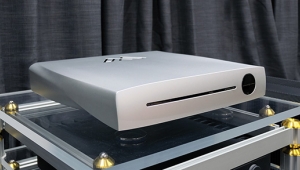
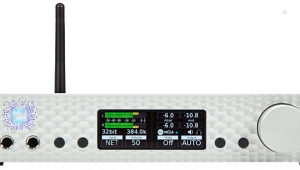
I tested the T+A Caruso R with my Audio Precision SYS2722 system, repeating some of the measurements with the magazine's APx500. I controlled the Caruso R with the front-panel touchscreen and with the Caruso Navigator app on my iPad mini. Because the Caruso R uses a class-D output stage, I inserted an Audio Precision AUX-0025 passive low-pass filter between the test load and the analyzers. This filter reduces (but does not completely eliminate) RF noise that could drive their input circuitry into slew-rate limiting. I used it for all the loudspeaker output tests other than frequency response. Without the auxiliary filter and with the amplifier loaded with 8 ohms, there was 720mV of ultrasonic noise present at the speaker outputs.
I looked first at the Caruso R's behavior as a conventional integrated amplifier via its single-ended analog inputs. The amplifier inverted absolute polarity at both the loudspeaker and headphone outputs but preserved polarity at the preamplifier output. The analog input impedance was 14k ohms. The maximum gain at the loudspeaker outputs into 8 ohms was a relatively low 29.9dB, while at the headphone output the maximum gain was 14.5dB. At the preamplifier output, the gain was –0.54dB, ie, just under unity gain.
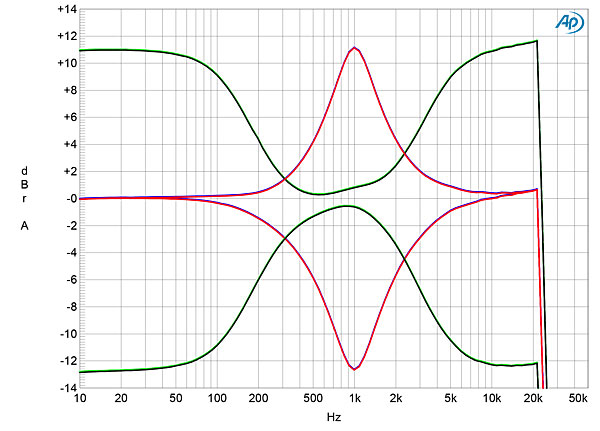
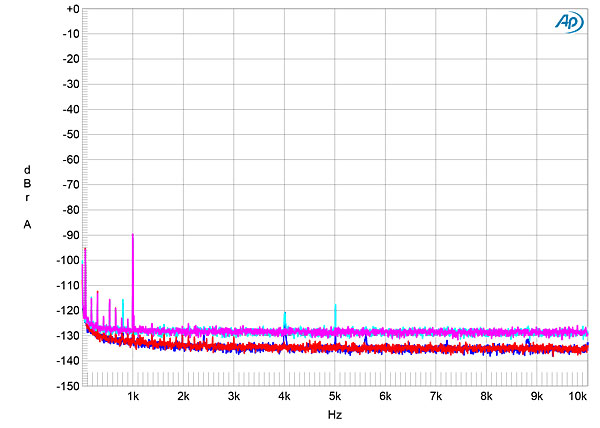
The headphone output impedance was a low 10 ohms across the audioband. At the preamplifier output, it was 23 ohms at 1kHz and 20kHz but rose to 135 ohms at 20Hz. I calculate an amplifier's output impedance by comparing the open-circuit voltage with the voltage when the amplifier is loaded by 8 or 4 ohms. At the loudspeaker outputs, even with the AP filter, the level of the ultrasonic noise increased with no resistive load connected, contaminating the voltage reading, so I couldn't directly calculate the output impedance. However, as the modulation of the amplifier's frequency response with my standard simulated loudspeaker was just ±0.2dB (fig.1, gray trace), it can be inferred that the T+A's output impedance, including the series impedance of 6' of spaced-pair speaker cable, is less than 0.2 ohms.
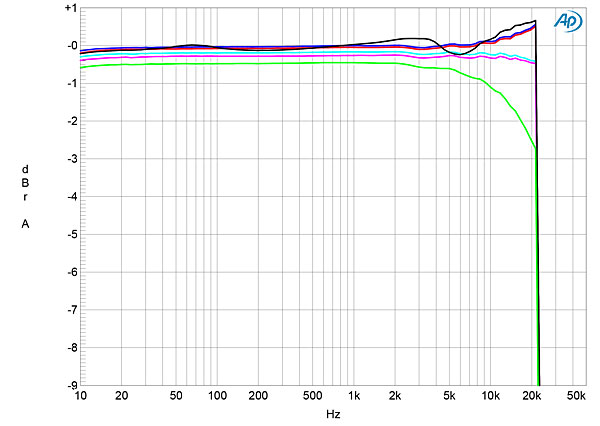
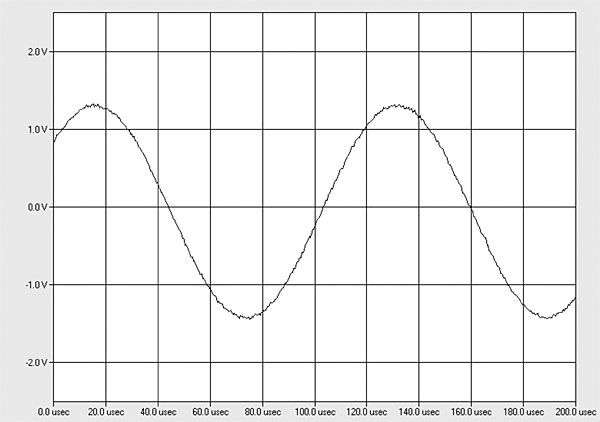
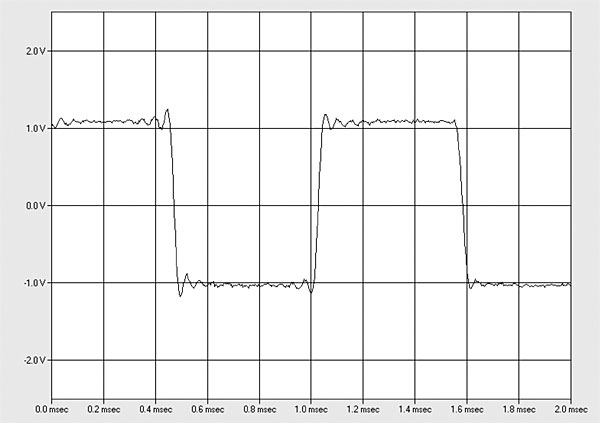
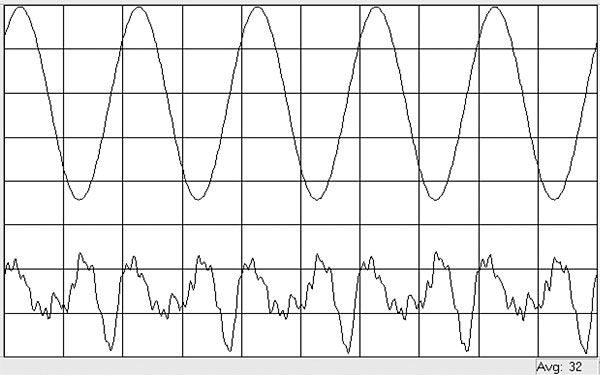
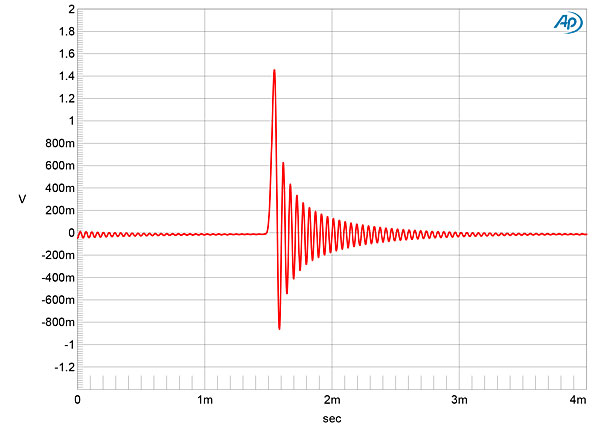
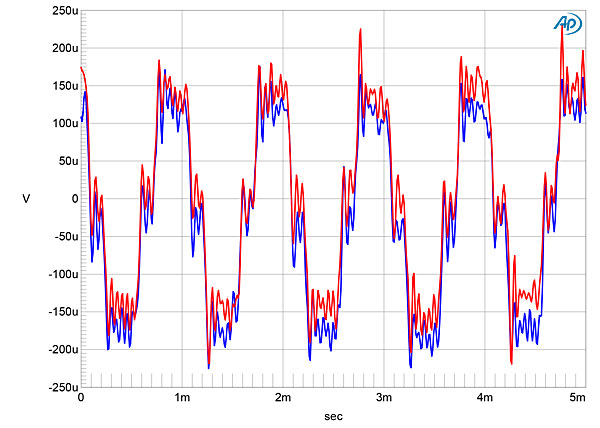
The response into resistive loads (fig.1, blue, red, cyan, magenta, and green traces) rolled off sharply above 21kHz. With this rolloff the T+A's reproduction of a 10kHz squarewave was a pure sinewave (fig.2). With a 1kHz sinewave (fig.3), the tops and bottoms of the squarewave had symmetrical ringing, which suggests that the Caruso R digitizes its analog inputs, most likely at a sample rate of 48kHz.
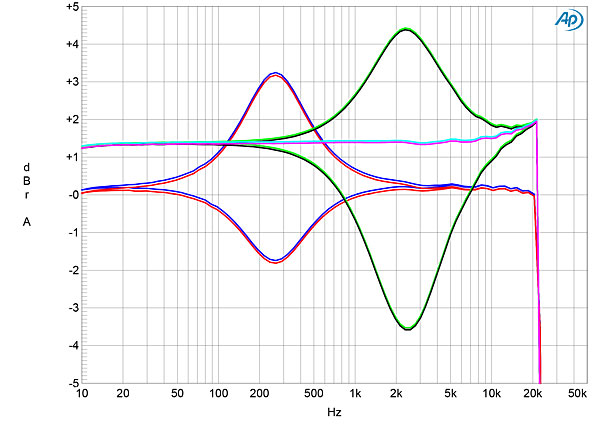
The Caruso R offers bass, midrange, and treble tone controls. Fig.4 shows the effect of these controls at their maximum and minimum, "±12" settings. They each offer up to +11dB/–12.5dB of boost or cut. The green and gray traces in fig.5 show the effect of the Contour Presence control at its maximum and minimum settings. It adjusts the 1.5–4kHz region by up to ±3.5dB. The Contour Fundamental control (blue and red traces) boosts or cuts the output at 250Hz by up to +3.2dB/–1.75dB.
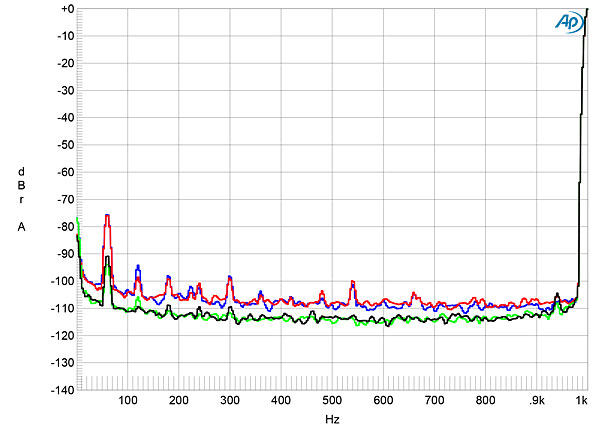
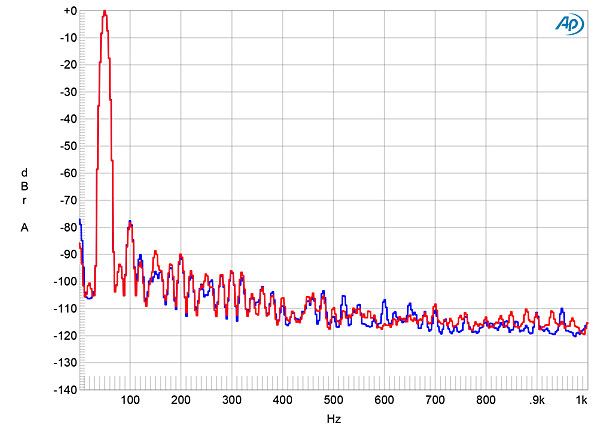
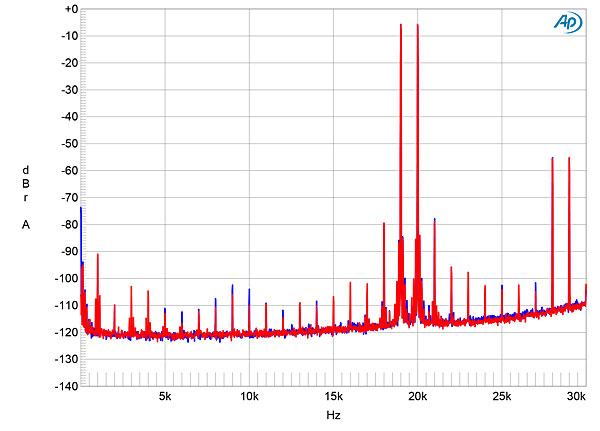
Channel separation was excellent at 90dB in both directions below 2kHz, dropping to a still good 65dB at the top of the audioband. The T+A's unweighted, wideband signal/noise ratio, taken with the unbalanced inputs shorted to ground but the volume control set to its maximum, was a poor 24.6dB ref. 2.83V into 8 ohms due to the residual ultrasonic noise not blocked by the auxiliary filter. This ratio improved to 69.25dB when the measurement bandwidth was restricted to the audioband and to 78.7dB when A-weighted. With the volume control set to its maximum, the background noise included power supply–related spurious tones at 60Hz and its low-order harmonics (fig.6, blue and red traces). Reducing the output level by 20dB (green and gray traces) lowered the random noise level by 7dB but didn't reduce the levels of the supply-related spuriae.
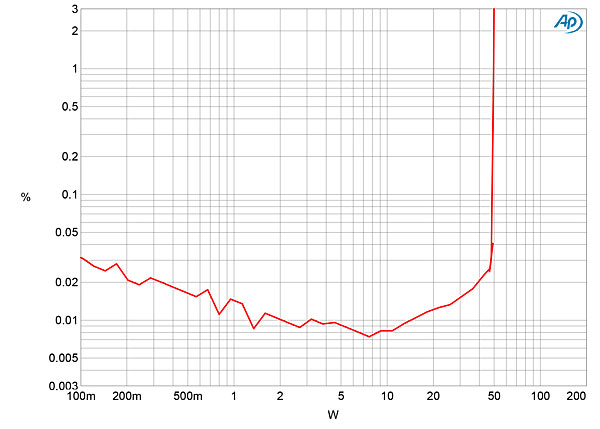
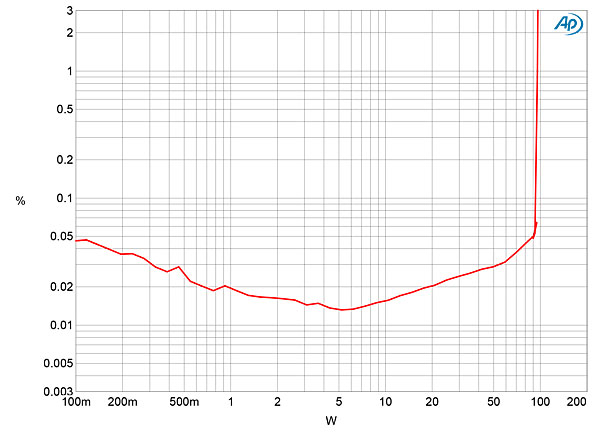
The Caruso R's maximum power is specified as 50Wpc into 8 ohms and 100Wpc into 4 ohms, both powers equivalent to 17dBW. We define clipping as when the THD+noise in an amplifier's output reaches 1%. By that standard, the Caruso R exactly met its specified power with both channels driven into 8 ohms (fig.7) and just missed the 4 ohm power, clipping at 96Wpc in that load (16.8dBW, fig.8).
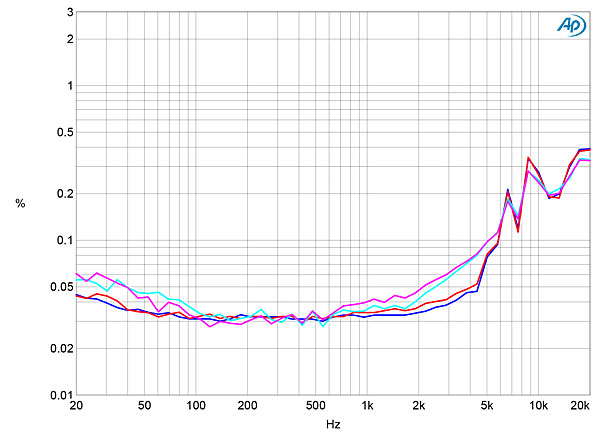
I examined how the THD+N percentage changed with frequency at 12.65V, which is equivalent to 20W into 8 ohms and 40W into 4 ohms (fig.9). The distortion into both loads was very low in the bass and midrange but rose in the top two audio octaves. The distortion was primarily the subjectively innocuous second harmonic (figs.10 & 11). Intermodulation distortion was also low (fig.12), though aliased images of the high-level 19 and 20kHz tones can be seen due to the analog input being digitized. (The frequencies of these images confirm that the digitizing frequency is 48kHz.)
I tested the Caruso R's performance with its digital inputs using the TosLink and coaxial S/PDIF ports, with WAV files on a USB thumb drive, and with network data sourced via Ethernet from Roon. (Roon recognized the T+A as an AirPlay device.) To avoid damaging the power amplifier stage with full-scale digital signals, I performed the measurements by looking at the preamplifier and headphone outputs, switching off the speaker outputs with the touchscreen.
As with the analog inputs, the digital inputs preserved polarity from the preamplifier output but inverted absolute polarity from the loudspeaker and headphone outputs. With a 1kHz tone at –12dBFS, the level at the preamplifier output was 625mV, and at the headphone output it was 1.21V. However, at the loudspeaker outputs the level was 10.55V into 8 ohms. This is equivalent to 13.9W into 8 ohms, which suggests that the digital inputs have around 5dB too much gain. I therefore continued the digital-input and CD testing with the volume control set to –5dB.
I looked first at CD playback, using the Pierre Verany Digital Test CD to check the Caruso R's error correction. It played the tracks with gaps in the data spiral up to 2mm in length without audible glitches, which is excellent performance. The T+A's impulse response, measured at the preamplifier output (fig.13), indicates that the reconstruction filter is a minimum-phase type, with all the Nyquist frequency ringing following the single sample at 0dBFS.
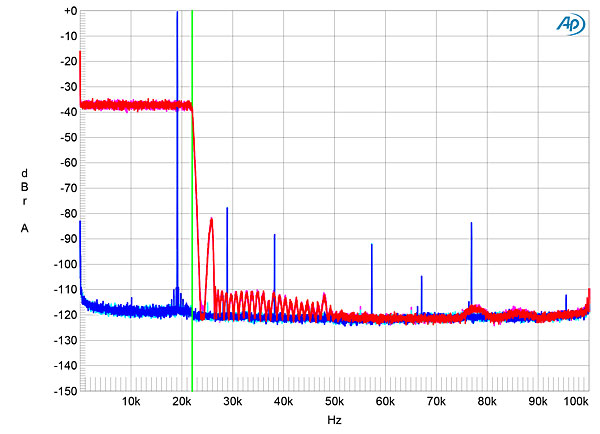
I got an anomalous result with white noise at –4dBFS, sampled at 44.1kHz. The audioband response, measured at the headphone output, was about 5dB too high in level and the level of the ultrasonic noise was much higher than I usually find. Reducing the output level with the volume control gave a much better result (fig.14, red and magenta traces), with the output reaching full stopband attenuation at 24kHz. The usual aliased image at 25kHz of a full-scale tone at 19.1kHz (blue and cyan traces) was absent, though a low-level spurious tone can be seen at 28.9kHz. (As this frequency is equivalent to 48kHz–19.1kHz, is it possible that the Caruso R's sample rate-converts 44.1kHz data to 48kHz?) The distortion harmonics of the 19.1kHz tone all lie below –84dB (0.006%), however.
The TosLink and coaxial S/PDIF inputs both locked to data with a sample rate up to 192kHz. Fig.15 shows the coaxial input's frequency response, measured at the preamplifier outputs, with data sampled at 44.1kHz (gray and green traces), 96kHz (cyan, magenta), and 192kHz (blue, red). The Caruso R's output rolls sharply above 20kHz at all three sample rates, which suggests that the high sample-rate data are downsampled. The right channel (gray, magenta, red traces) is about 0.5dB higher in level than the left (green, cyan, blue). I checked that the balance control was centered with both the app and the touchscreen. It was. More low-frequency rolloff is visible in the left-channel traces than the right, reaching –3dB at 20Hz. (The subwoofer mode was bypassed for this measurement.) When I repeated this test at the headphone output (not shown), the channels were perfectly matched in level and the low-frequency rolloff was –1dB at 10Hz in both channels. Again, however, the responses with 96kHz and 192kHz data rolled off sharply above 20kHz.
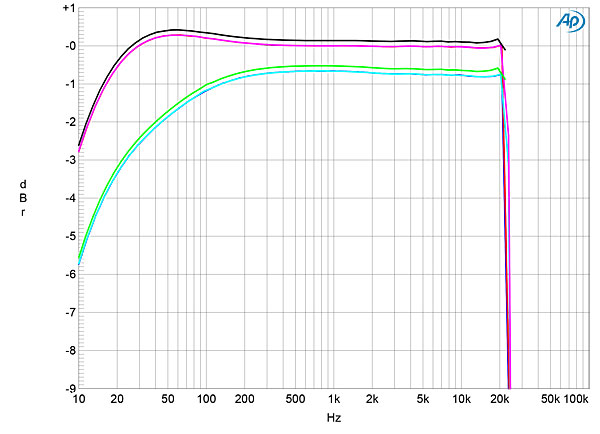
Fig.16 shows the Caruso R's output spectrum with a dithered 1kHz tone at –90dBFS with 16-bit data (blue and cyan traces) and with 24-bit data (magenta and red traces), taken from the headphone output. (I used the app to ensure that the quality was set to "highest.") The noisefloor dropped by 4–5dB with 24-bit data, which implies that the T+A's digital inputs offer between 16 and 17 bits of resolution. With undithered 16-bit data representing a tone at exactly –90.31dBFS (fig.17), the three DC voltage levels described by the data were obscured by random noise from the preamplifier output but were well-resolved from the headphone output, with the reconstruction filter's minimum phase ringing visible at the bit transitions.
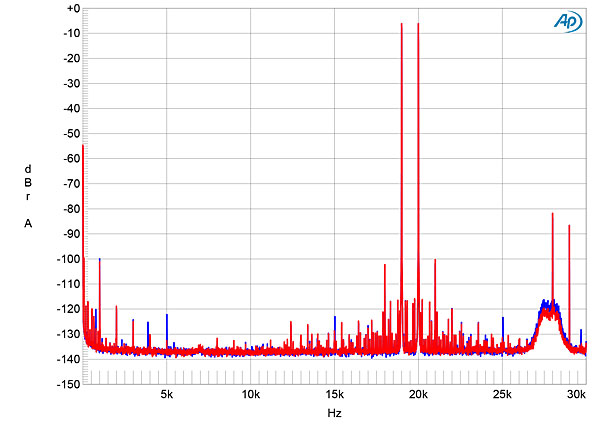
Intermodulation distortion with a mix of equal levels of 19 and 20kHz tones sampled at 44.1kHz, with the waveform peaking at 0dBFS, was low, the second-order difference product at 1kHz lying at –100dB (0.001%) in both channels (fig.18).
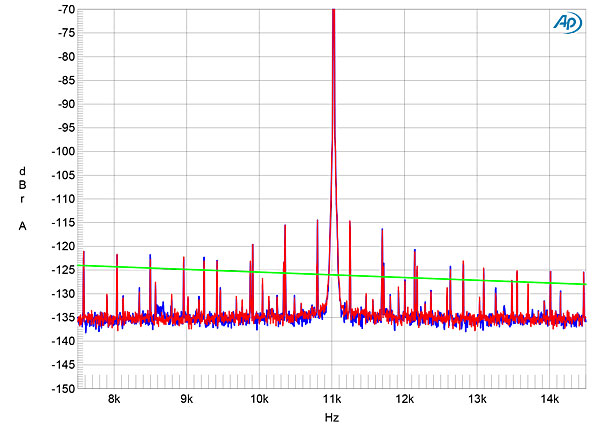
I tested the Caruso R's rejection of word-clock jitter with the Miller-Dunn J-Test signal. With this signal played on CD and with the TosLink, coaxial, and USB inputs, the harmonics of the LSB-level, low-frequency squarewave were all a little higher in level than they should be (shown by the sloping green line in fig.19), and other low-level sidebands were present. This spectrum was taken from the headphone output; repeating the analysis from the preamplifier output gave a similar result in the right channel but the left channel's spectrum was contaminated with high-frequency noise.
The T+A Caruso R offers a very wide range of functions and offers respectable measured performance as a conventional integrated amplifier. However, while it will accept hi-rez material fed to its digital inputs, its sample rate is restricted to 48kHz and its resolution to 16 bits. These facts dominate its measured performance.—John Atkinson
|
| ||||||||||


| Loudspeakers Amplification Digital Sources | Analog Sources Accessories Featured | Music Columns Retired Columns | Show Reports | Features Latest News Community | Resources Subscriptions |
 © 2024 Stereophile