Sidebar 3: Measurements
I measured Ayre Acoustics' EX-8 Integrated Hub with my Audio Precision SYS2722 system (see the January 2008 "As We See It"). Before performing any testing, I updated the firmware over my network and ran the EX-8 at one-third power into 8 ohms. At the end of that period its top panel was warm, at 107.1°F (41.8°C). However, the bottom panel, which acts as the heatsink for the output devices, was hot, at 124.8°F (51.6°C). EX-8 owners should make sure the amplifier is well ventilated.
Looking first at the line-level analog inputs: With the volume control at its maximum setting, the voltage gain at 1kHz into 8 ohms measured 26dB from the speaker terminals for both the balanced and unbalanced inputs. This is on the low side for an integrated amplifier. The maximum gains from the headphone outputs were 9.4dB balanced and 3.4dB unbalanced. The line inputs preserved absolute polarity (ie, were non-inverting) from all outputs. The unbalanced input impedance was 18k ohms at low and middle frequencies, dropping very slightly to 17k ohms at 20kHz. The balanced input impedance was twice the unbalanced value, as expected. These impedances are very much lower than the specified, respectively 1M ohm and 2M ohms (footnote 1), but are still high enough not to load down source components.
The single-ended headphone output impedance was a low 3.7 ohms at all audio frequencies. The balanced output impedance was twice this value, as expected, but still low in absolute terms. The output impedance at the speaker terminals (including cables) was 0.45 ohm from 20Hz to 20kHz. This is relatively high for a solid-state design, presumably due to the lack of open-loop negative feedback around the output stage, and resulted in a modulation of the frequency response with our standard simulated loudspeaker of ±0.3dB (fig.1, gray trace). The response was flat to 20kHz into resistive loads (fig.1, blue, red, and green traces), rolling off above the audioband to reach –3dB above 200kHz. Fig.1 was taken with the volume control set to its maximum; the response didn't change at lower volume settings. However, an imbalance developed in favor of the left channel at lower settings of the volume control, reaching a maximum difference of 0.9dB at –20dB, but less at higher and lower settings. The Ayre's reproduction of a 10kHz squarewave (fig.2) was superbly square, with short risetimes, but with a very slight but critically damped overshoot visible.


 The EX-8 is specified to deliver a maximum continuous output power of 100Wpc into 8 ohms (20dBW). At our usual definition of clipping (ie, when the percentage of THD+noise in the amplifier's output reaches 1%), with continuous drive in both channels, the Ayre exceeded that spec by 0.2dB, delivering 105Wpc into 8 ohms (fig.4, 20.2dBW). With both channels driven into 4 ohms, the EX-8 clipped at 125W (fig.5, 18dBW). The distortion was extremely low below 1W into either impedance, but rose to 10W or so, then decreased slightly before actual waveform clipping occurred.

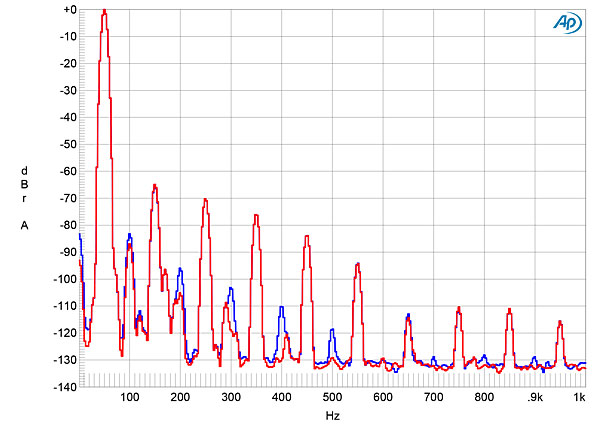
 Measured against frequency at a moderate output level, 8.95V—equivalent to 10W into 8 ohms, 20W into 4 ohms, and 40W into 2 ohms—the distortion levels were respectably low into the two lower impedances (fig.6, blue, red, cyan, and magenta traces), but the EX-8 was less happy driving 2 ohms (gray). The shape of the distortion-spuriae waveform indicated the presence of higher-order harmonic products (fig.7). Spectral analysis indicated that the third harmonic was the highest in level, with higher odd-order harmonics present (fig.8). Second-order intermodulation distortion at a relatively high power into 8 ohms was very low, the product at 1kHz resulting from an equal mix of 19 and 20kHz tones lying at –99dB (fig.9). High-order products were present at higher levels, and these further increased when I repeated the test into 4 ohms.


 The Ayre's impulse response with 44.1kHz data (fig.10) indicates that its reconstruction filter is a short minimum-phase type, with a small degree of ringing following the single sample at 0dBFS. This impulse response is identical to that of the Listen filter used in the other digital products from Ayre that we've reviewed since the QB-9 USB DAC, in 2009. With 44.1kHz-sampled white noise (fig.11, red and magenta traces), the EX-8's response rolled off slowly above the audioband, not reaching full stop-band suppression until almost an octave above the Nyquist frequency of 22.05kHz (vertical green line). An aliased image at 25kHz of a full-scale tone at 19.1kHz (blue and cyan traces) is suppressed by only 11dB, therefore. The distortion harmonics of the 19.1kHz tone are visible above the ultrasonic noise floor, the highest in level being the third, at –78dB (0.012%), but these are obscured by other aliasing products.

 When I examined the EX-8's digital frequency response with S/PDIF data at 44.1, 96, and 192kHz, the response followed the same basic shape at each sample rate, with a slow rolloff that reached –3dB at 20kHz with 44.1kHz data (fig.12, green and gray traces). With data sampled at 384kHz (not shown), the output rolled off in a manner similar to the 192kHz data, but reached –9dB at 102kHz rather than at 90kHz. The output with 384kHz data was down by 24dB at 192kHz, that sample rate's Nyquist frequency.


 Intermodulation distortion via the EX-8's digital inputs was low, though a large number of aliasing products were present (fig.16). When I tested the digital inputs' rejection of word-clock jitter with 16-bit J-Test data, the odd-order harmonics of the LSB-level, low-frequency squarewave were all at the correct levels (fig.17, sloping green line), though sidebands at the power-supply–related frequencies of ±120 and ±240Hz can be seen and were also present with 24-bit J-Test data (fig.18). These sidebands were accentuated with USB data (fig.19).


Footnote : This very high specified input impedance was a typo in the manual.
Fig.1 Ayre EX-8, analog input, volume control at max, frequency response at 2.83V into: simulated loudspeaker load (gray), 8 ohms (left channel blue, right red), 4 ohms (left cyan, right magenta), 2 ohms (green) (0.5dB/vertical div.).
Fig.2 Ayre EX-8, analog input, small-signal, 10kHz squarewave into 8 ohms.
Channel separation was excellent, at >100dB in both directions below 2kHz, decreasing to 80dB at 20kHz, which I assume is due to capacitive coupling between the channels. With the analog inputs shorted to ground and the volume control set to its maximum, the wideband, unweighted signal/noise ratio (ref. 2.83V into 8 ohms) measured 75.25dB in the left channel and 73.8dB in the right, both results superb. Restricting the measurement bandwidth to 22kHz increased the ratio to 85.7dB in both channels, and an A-weighting filter increased it further, to 88.5dB. Levels of residual spuriae at the AC power-line frequency and its harmonics were very low (fig.3).
Fig.3 Ayre EX-8, analog input, spectrum of 1kHz sinewave, DC–1kHz, at 1W into 8 ohms (left channel blue, right red; linear frequency scale).
Fig.4 Ayre EX-8, analog input, distortion (%) vs 1kHz continuous output power into 8 ohms, both channels driven.
Fig.5 Ayre EX-8, analog input, distortion (%) vs 1kHz continuous output power into 4 ohms, both channels driven.
Fig.6 Ayre EX-8, analog input, distortion (%) vs frequency at 8.95V into: 8 ohms (left channel blue, right red), 4 ohms (left cyan, right magenta), 2 ohms (gray).
Fig.7 Ayre EX-8, analog input, 1kHz waveform at 10W into 8 ohms, 0.025% THD+N (top); distortion and noise waveform with fundamental notched out (bottom, not to scale).
Fig.8 Ayre EX-8, analog input, spectrum of 50Hz sinewave, DC–1kHz, at 20Wpc into 8 ohms (left channel blue, right red; linear frequency scale).
Fig.9 Ayre EX-8, analog input, HF intermodulation spectrum, DC–30kHz, 19+20kHz at 20Wpc peak into 8 ohms (left channel blue, right red; linear frequency scale).
Turning to the digital inputs, the EX-8's AES/EBU and coaxial and optical S/PDIF inputs locked to datastreams with all sample rates up to 192kHz, and preserved absolute polarity. Apple's USB Prober utility identified the EX-8 as "Ayre USB Interface" from "Ayre Acoustics" with the serial number "Streamlength(tm)." USB Prober confirmed that the EX-8's USB port operated in the optimal isochronous asynchronous mode. The AudioMIDI utility revealed that the EX-8's USB port could handle 24-bit integer data at all sample rates up to 384kHz. A 1kHz digital signal at –12dBFS resulted in an output level of 17.32V into 8 ohms with the volume control at its maximum setting, which suggests that the digital inputs have too much gain—ie, a digital signal at –7dBFS with the volume control up full will just drive the amplifier into clipping into 8 ohms. Using the menu to turn off the speaker outputs, I continued testing the digital inputs from the balanced preamplifier outputs.
Fig.10 Ayre EX-8, digital input, impulse response (one sample at 0dBFS, 44.1kHz sampling, 4ms time window).
Fig.11 Ayre EX-8, digital input, wideband spectrum of white noise at –4dBFS (left channel red, right magenta) and 19.1kHz tone at 0dBFS (left blue, right cyan), with data sampled at 44.1kHz (20dB/vertical div.).
Fig.12 Ayre EX-8, digital input, frequency response at –12dBFS into 100k ohms with data sampled at: 44.1kHz (left channel green, right gray), 96kHz (left cyan, right magenta), 192kHz (left blue, right red) (1dB/vertical div.).
When I increased the bit depth from 16 to 24 with a dithered 1kHz tone at –90dBFS (fig.13), the noise floor dropped by about 15dB, meaning that the EX-8 offers between 18 and 19 bits' worth of resolution. With undithered data representing a tone at exactly –90.31dBFS, the three DC voltage levels described by the data were well resolved and the waveform was perfectly symmetrical (fig.14). With 24-bit data, the result was a well-formed sinewave (fig.15)
Fig.13 Ayre EX-8, digital input, spectrum with noise and spuriae of dithered 1kHz tone at –90dBFS with: 16-bit data (left channel cyan, right magenta), 24-bit data (left blue, right red) (20dB/vertical div.).
Fig.14 Ayre EX-8, waveform of undithered 1kHz sinewave at –90.31dBFS, 16-bit data (left channel blue, right red).
Fig.15 Ayre EX-8, waveform of undithered 1kHz sinewave at –90.31dBFS, 24-bit data (left channel blue, right red).
Fig.16 Ayre EX-8, HF intermodulation spectrum, DC–30kHz, 19+20kHz at 0dBFS into 100k ohms, 44.1kHz data (left channel blue, right red; linear frequency scale).
Fig.17 Ayre EX-8, digital input, high-resolution jitter spectrum of analog output signal, 11.025kHz at –6dBFS, sampled at 44.1kHz with LSB toggled at 229Hz: 16-bit AES3 data (left channel blue, right red). Center frequency of trace, 11.025kHz; frequency range, ±3.5kHz.
Fig.18 Ayre EX-8, digital input, high-resolution jitter spectrum of analog output signal, 11.025kHz at –6dBFS, sampled at 44.1kHz with LSB toggled at 229Hz: 24-bit AES3 data (left channel blue, right red). Center frequency of trace, 11.025kHz; frequency range, ±3.5kHz.
Fig.19 Ayre EX-8, digital input, high-resolution jitter spectrum of analog output signal, 11.025kHz at –6dBFS, sampled at 44.1kHz with LSB toggled at 229Hz: 24-bit USB data (left channel blue, right red). Center frequency of trace, 11.025kHz; frequency range, ±3.5kHz.
Ayre's EX-8 Integrated Hub offers generally excellent measured performance in both the analog and digital domains, but I was somewhat concerned by its harmonic distortion signature. I do wonder if using the chassis as the heatsink means that the output stage can't be biased too strongly into class-A.—John Atkinson
Footnote : This very high specified input impedance was a typo in the manual.


