Sidebar 3: Measurements
I measured the Benchmark DAC3 HGC with my Audio Precision SYS2722 system (see the January 2008 As We See It"), using both the Audio Precision's optical and electrical digital outputs and USB data sourced from my MacBook Pro running on battery power with Pure Music 3.0 playing WAV and AIFF test-tone files. Apple's USB Prober utility identified the DAC3 as "Benchmark DAC2 USB Audio 2.0" from "Benchmark DAC2" (sic), with the serial-number field occupied by "0000." The USB port operated in the optimal isochronous asynchronous mode, and Apple's AudioMIDI utility revealed that, via USB, the DAC3 accepted 24-bit integer data at all sample rates from 44.1 to 192kHz. The optical inputs accepted data sampled up to 96kHz, the coaxial inputs up to 192kHz.
The Benchmark's maximum output level at 1kHz was a very high 18.3V from the balanced output jacks with the output level set to "0." Using the internal jumpers to insert the 10dB pad, which is how JCA used the DAC3, reduced the maximum level by exactly 10dB, to 5.8V. The 20dB pad reduced the level by 19.7dB. From the unbalanced jacks, the maximum output level was 2.96V at all settings of the internal pad, which operates only on the balanced output. The headphone outputs have three level settings, again achieved with internal jumpers. The maximum output levels from the headphone jacks were 9.17V, 3V, and 991mV. With the orange Polarity LED off, all outputs preserved absolute polarity (ie, were non-inverting). The unbalanced output impedance measured 30 ohms at all audio frequencies; the output impedance of the headphone outputs measured 0.5 ohm (including 6' of interconnect), again at all audio frequencies. The balanced output impedance depended on whether or not a pad was engaged. With the level set to "0," the output impedance was a very low 60 ohms across the audioband. Set to "–10," the impedance was a still-low 407 ohms; set to "–20," it was 134 ohms.
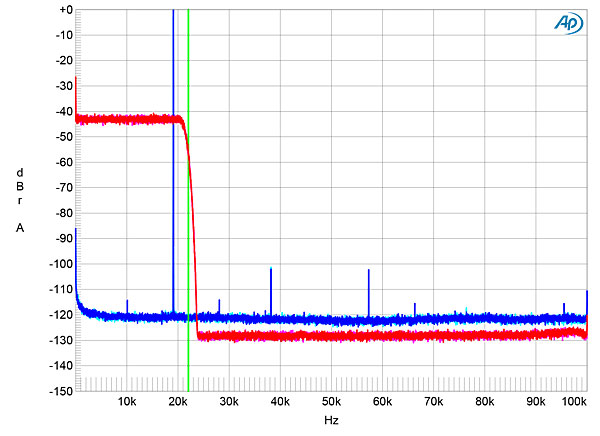
Fig.1 shows the DAC3's impulse response with data sampled at 44.1kHz. It reveals that the reconstruction filter is a conventional linear-phase type. This filter rolls off rapidly above 20kHz (fig.2, magenta and red traces), and the aliased image at 25kHz of a full-scale 19.1kHz tone (fig.2, cyan and blue traces) is completely suppressed. In this graph, note the very low levels of the distortion harmonics of that tone. Fig.3 shows the Benchmark's frequency response, measured with spot tones sampled at 44.1, 96, and 192kHz. The output is flat almost up to each Nyquist frequency (half the sample rate), above which there is a very steep rolloff. Channel separation via the digital inputs was superb, at 124dB in both directions at 1kHz, and was still almost 110dB at 20kHz.


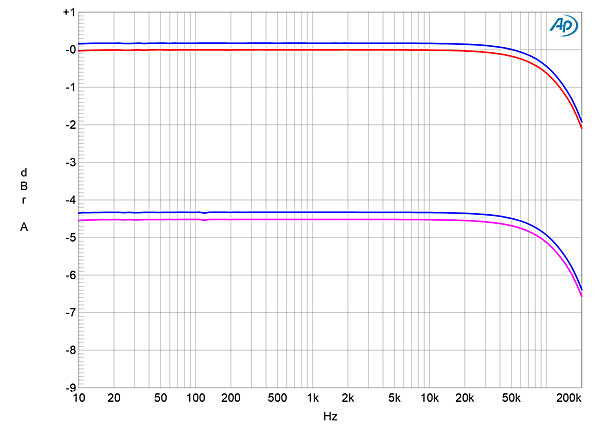
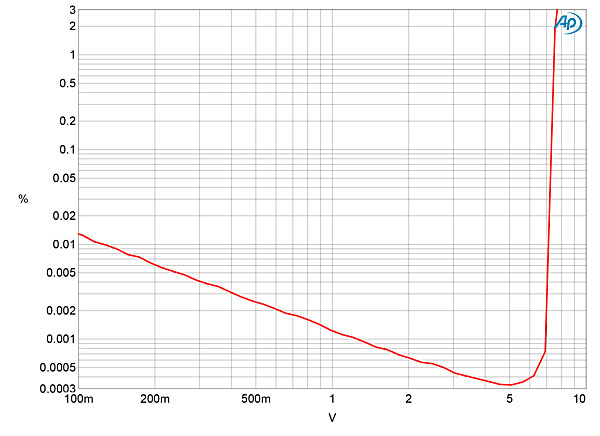
 Used as an analog–analog preamplifier, the DAC3 HGC offered an unbalanced input impedance of just under 19k ohms at 20Hz and 1kHz, this dropping slightly to 17.4k ohms at 20kHz. (There are no balanced analog inputs.) The maximum gain was 19.9dB from the balanced line outputs, 4.1dB from the unbalanced line outputs, and both sets of outputs preserved absolute polarity. The analog inputs offered a very wide frequency response that was not affected by reducing the load impedance from 100k ohms to 600 ohms or by varying the volume-control settings. The channels were superbly matched, both dropping by only 2dB at 200kHz (fig.13). Channel separation via the analog inputs was not quite as good as it had been for the digital inputs but was still superb in absolute terms, at >103dB below 1kHz. Fig.14 plots how the Benchmark's percentage of THD+noise varied with its balanced output voltage into 100k ohms for its analog inputs. (The 10dB pad was selected for this measurement.) The downward slope of the trace below 5V indicates that the actual distortion lies below the noise floor and is just 0.00032% at 5V. Actual waveform clipping (defined as when the THD+N reaches 1%) occurred at 7.5V. Reducing the load to 600 ohms lowered the clipping point to 4.1V, but the distortion remained similarly superbly low below 3.3V.
 As with its predecessor, the DAC2 HGC, which Erick Lichte reviewed for Stereophile in February 2014, Benchmark's DAC3 HGC offers state-of-the-art measured performance. All I can say is "Wow!"—John Atkinson
Fig.1 Benchmark DAC3 HGC, impulse response (one sample at 0dBFS, 44.1kHz sampling, 4ms time window).
Fig.2 Benchmark DAC3 HGC, wideband spectrum of white noise at –4dBFS (left channel red, right magenta) and 19.1kHz tone at 0dBFS (left blue, right cyan), with data sampled at 44.1kHz (20dB/vertical div.).
Fig.3 Benchmark DAC3 HGC, frequency response at –12dBFS into 100k ohms with data sampled at: 44.1kHz (left channel green, right gray), 96kHz (left cyan, right magenta), 192kHz (left blue, right red) (1dB/vertical div.).
The Benchmark DAC3 featured extraordinarily low levels of analog noise at its outputs. Fig.4 shows the low-frequency spectrum of the output while the DAC decoded dithered 24-bit data representing a 1kHz tone at –60dBFS. No power-supply–related spuriae can be seen, and the random noise floor lies below –160dBFS! When the DAC3 decoded dithered 16- and 24-bit data representing a 1kHz tone at –90dBFS, the increase in bit depth dropped the noise floor by more than 30dB (fig.5), indicating that the Benchmark's resolution is at least 21 bits. This is as good as a DAC can currently get!
Fig.4 Benchmark DAC3 HGC, spectrum with noise and spuriae of dithered 1kHz tone at –60dBFS with: 24-bit data (left channel blue, right red) (20dB/vertical div.).
Fig.5 Benchmark DAC3 HGC, spectrum with noise and spuriae of dithered 1kHz tone at –90dBFS with: 16-bit data (left channel cyan, right magenta), 24-bit data (left blue, right red) (20dB/vertical div.).
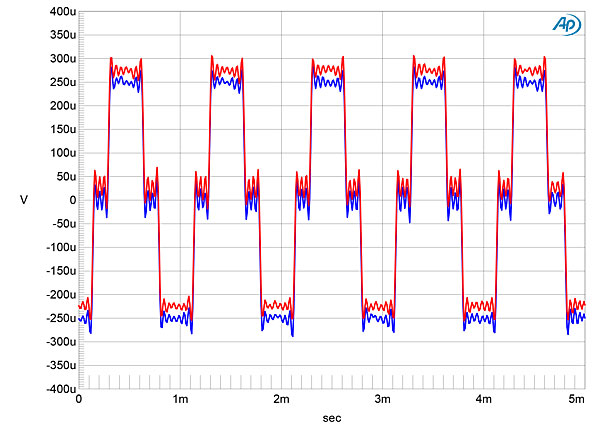
With its very low noise floor and correspondingly very high resolution, the DAC3's reproduction of an undithered 16-bit tone at exactly–90.31dBFS was perfect (fig.6). The waveform is symmetrical, the three DC voltage levels described by the data are superbly well defined, the Gibbs Phenomenon ringing on the waveform tops and bottoms is clearly visible, and there is almost zero DC offset. With undithered 24-bit data (fig.7) the result was a very clean sinewave, despite the very low signal level.
Fig.6 Benchmark DAC3 HGC, waveform of undithered 1kHz sinewave at –90.31dBFS, 16-bit TosLink data (left channel blue, right red).
Fig.7 Benchmark DAC3 HGC, waveform of undithered 1kHz sinewave at –90.31dBFS, 24-bit TosLink data (left channel blue, right red).
As suggested by the spectra in fig.2, the Benchmark DAC3 offers extremely low levels of harmonic distortion from all its outputs. Fig.8 shows the spectrum at the headphone output of a full-scale, 24-bit, 50Hz tone into 300 ohms. The highest-level harmonic is the third , at –104dB (0.0006%), with the second harmonic lying at –112dB in the left channel (blue trace) and –117dB in the right (red). Intermodulation distortion (fig.9) was similarly vanishingly low.
Fig.8 Benchmark DAC3 HGC, spectrum of 50Hz sinewave, DC–1kHz, at 0dBFS into 600 ohms (left channel blue, right red; linear frequency scale).
Fig.9 Benchmark DAC3 HGC, HF intermodulation spectrum, DC–30kHz, 19+20kHz at 0dBFS into 100k ohms, 44.1kHz data (left channel blue, right red; linear frequency scale).
Fed 16-bit J-Test data via one of its optical TosLink inputs, the DAC3's output featured all the odd-order harmonics of the low-frequency, LSB-level squarewave at the correct levels (fig.10, sloping green line), and no other sidebands can be seen. With 24-bit J-Test S/PDIF data (fig.11), the spectrum was free from spuriae of any kind. However, with USB data a pair of sidebands appeared at ±1518Hz (fig.12), though it is fair to note that these are at a very low level.
Fig.10 Benchmark DAC3 HGC, high-resolution jitter spectrum of analog output signal, 11.025kHz at –6dBFS, sampled at 44.1kHz with LSB toggled at 229Hz: 16-bit TosLink data (left channel blue, right red). Center frequency of trace, 11.025kHz; frequency range, ±3.5kHz.
Fig.11 Benchmark DAC3 HGC, high-resolution jitter spectrum of analog output signal, 11.025kHz at –6dBFS, sampled at 44.1kHz with LSB toggled at 229Hz: 24-bit TosLink data (left channel blue, right red). Center frequency of trace, 11.025kHz; frequency range, ±3.5kHz.
Fig.12 Benchmark DAC3 HGC, high-resolution jitter spectrum of analog output signal, 11.025kHz at –6dBFS, sampled at 44.1kHz with LSB toggled at 229Hz: 24-bit USB data (left channel blue, right red). Center frequency of trace, 11.025kHz; frequency range, ±3.5kHz.
Fig.13 Benchmark DAC3 HGC, unbalanced analog input, frequency response into 100k ohms (top) and 600 ohms (bottom).
Fig.14 Benchmark DAC3 HGC, unbalanced analog input, balanced distortion (%) vs 1kHz output voltage into 100k ohms.


