Sidebar 3: Measurements
I used DRA Labs' MLSSA system and a calibrated DPA 4006 microphone to measure the Bowers & Wilkins 683 S2's frequency response in the farfield; and an Earthworks QTC-40, with its small, ¼"-diameter capsule, for the nearfield responses.
The 683 S2 is specified as having a sensitivity of 89dB/W/m; my estimate of its voltage sensitivity was slightly lower, at 87.7dB(B)/2.83V/m. The impedance, specified as 8 ohms, drops below 4 ohms in the lower midrange and in the top audio octave (fig.1), with a minimum magnitude of 2.92 ohms at 124Hz, very close to B&W's specified minimum of 3 ohms.

 Higher in frequency in fig.3, the crossover from the woofers to the midrange drive-unit (blue trace), measured in the farfield on the tweeter axis, occurs at 500Hz rather than the specified 400Hz, with steep filter slopes. The 683 S2's higher frequency response on this axis is disturbed by peaks and troughs of approximately equal amplitude—these are also evident in the overall response averaged across a 30° horizontal window centered on the tweeter axis, with the complex sum of nearfield responses plotted below 300Hz (fig.4). The rise in the B&W's upper-bass response is almost entirely an artifact of the nearfield measurement technique; the speaker is basically tuned to be maximally flat, with a –6dB point at the port tuning frequency of 27Hz.

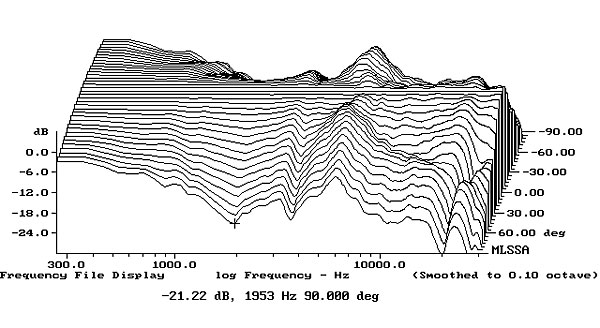
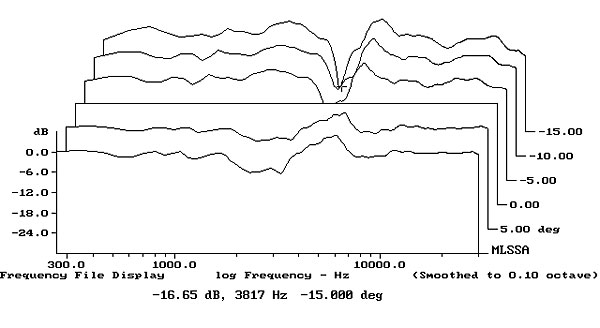


Fig.1 B&W 683 S2, electrical impedance (solid) and phase (dashed) (2 ohms/vertical div.).
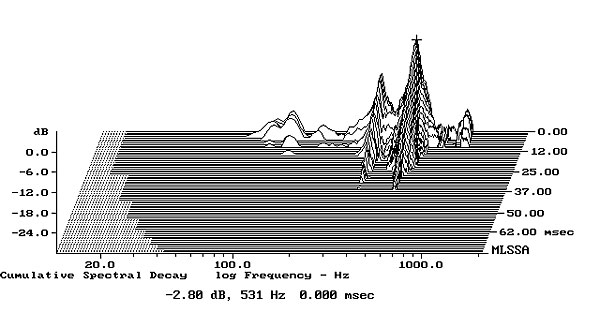
A small discontinuity in the impedance traces just above 200Hz implies the presence of some kind of cabinet resonance in that region. However, when I investigated the enclosure's vibrational behavior with a plastic-tape accelerometer, the primary resonance mode that I found, on all surfaces other than the top, lay at a high 531Hz, with a lower-amplitude mode at 348Hz (fig.2). These resonances are of fairly high Q and, taking into account their frequencies and amplitudes, unlikely to lead to any reduction in sound quality.
Fig.2 B&W 683 S2, cumulative spectral-decay plot calculated from output of accelerometer fastened to center of side panel level with midrange unit (MLS driving voltage to speaker, 7.55V; measurement bandwidth, 2kHz).
The red trace in fig.3 shows the output of the 683 S2's front-panel port, measured in the nearfield. It peaks between 20 and 40Hz, with the corresponding minimum-motion notch in the woofers' output (green trace) lying at 27Hz, as expected from the impedance graph. The two woofers behave identically above 50Hz, though with slightly different notch frequencies below 50Hz. Small blips are visible in the woofer and port responses just above 200Hz—the region where, probably and not coincidentally, the glitch in the impedance traces occurred.
Fig.3 B&W 683 S2, acoustic crossover on tweeter axis at 50", with nearfield responses of midrange unit (blue), woofers (green), and port (red), respectively plotted below 350Hz, 450Hz, and 600Hz.
Fig.4 B&W 683 S2, anechoic response on tweeter axis at 50", averaged across 30° horizontal window and corrected for microphone response, with complex sum of nearfield responses plotted below 300Hz.
Fig.5 shows the 683 S2's lateral dispersion, normalized to the tweeter-axis response. This graph shows that the on-axis notch between 1 and 2kHz deepens off axis, which will give the speaker a slightly polite balance—as Kal Rubinson noted, the presence of voices was not fleshed out to his complete satisfaction—though the similar notch an octave higher fills in to the speaker's sides, which is why experimenting with toe-in is important. In the vertical plane (fig.6, the traces again normalized to the tweeter-axis response), a sharply defined notch appears at the tweeter/midrange crossover frequency above the tweeter axis, while this graph also suggests that the optimal height for a seated listener's ears is actually slightly below the tweeter axis, which is 38" from the floor with the speaker sitting on its plinth.
Fig.5 B&W 683 S2, lateral response family at 50", normalized to response on tweeter axis, from back to front: differences in response 90–5° off axis, reference response, differences in response 5–90° off axis.
Fig.6 B&W 683 S2, vertical response family at 50", normalized to response on tweeter axis, from back to front: differences in response 15–5° above axis, reference response, differences in response 5–10° below axis.
This is confirmed by the step response on the tweeter axis (fig.7), where the decay of the tweeter's step (the sharp spike at 3.7ms) doesn't blend quite smoothly with the start of the midrange unit's step. This graph also reveals that all four drive-units are connected in positive polarity. The cumulative spectral-decay plot on the tweeter axis (fig.8) shows an impressively clean decay in the tweeter's passband, but some residual energy at 3640Hz, the frequency of the on-axis peak. I note that KR found the 683 S2 to have a smooth balance of midrange and treble, so perhaps this behavior measures worse than it sounds, though it would add to the sense of detail conveyed by the speaker.
Fig.7 B&W 683 S2, step response on tweeter axis at 50" (5ms time window, 30kHz bandwidth).
Fig.8 B&W 683 S2, cumulative spectral-decay plot on tweeter axis at 50" (0.15ms risetime).
Having visited the Bowers & Wilkins Research Center, in Steyning, nestled beneath England's South Downs, and been impressed by the depth of the company's engineering expertise, I am always puzzled by the fact that B&W speakers don't measure as well as they could. But its measurements do reveal that, other than that lack of upper-midrange energy, the sound quality of B&W's 683 S2 has been carefully managed and better than one might expect for just $1650/pair.—John Atkinson


