Sidebar 3: Measurements
I used DRA Labs' MLSSA system and a calibrated DPA 4006 microphone to measure the Bowers & Wilkins 705 Signature's frequency response in the farfield, and an Earthworks QTC-40 mike for the nearfield and in-room responses. I measured the impedance with MLSSA, checking the results with Dayton Audio's DATS V2 system. I used the formula in a 1994 JAES paper by Eric Benjamin to calculate with Microsoft Excel what UK writer Keith Howard has called the "equivalent peak dissipation resistance" (EPDR, footnote 1).
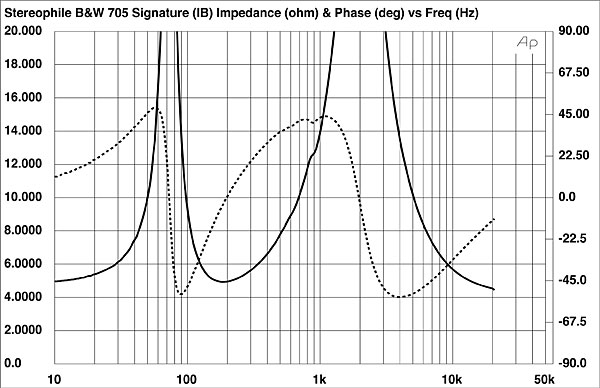
Bowers & Wilkins specifies the 705 Signature's sensitivity as 88dB/2.83V/m; my estimate was within experimental error of that figure, at 87.6dB(B)/2.83V/m. The 705 Signature's impedance is specified as 8 ohms. The impedance magnitude (fig.1, solid trace) stays above 8 ohms in the midrange and mid-treble region, with minimum values of 5 ohms between 169Hz and 210Hz and 4.55 ohms above 20kHz. Though these impedance magnitudes are higher than the specified minimum value of 3.7 ohms, the electrical phase angle (dashed trace) is occasionally high when the magnitude is relatively low. For example, there is a combination of 6 ohms and –33° at 130Hz. As the 705 Signature has minimum EPDRs of 2.63 ohms at 46Hz, 2.4 ohms between 120 and 130Hz, and 2.18 ohms between 8.2kHz and 9.6kHz, it will work best with amplifiers that are comfortable driving 4 ohm loads. With the 705 Signature's port blocked, the impedance magnitude trace had a single peak in the bass, reaching 38 ohms at a relatively high 73.5Hz (fig.2).

 The saddle centered at 55Hz in the impedance magnitude trace suggests that this is the tuning frequency of the flared port on the rear panel. The minimum-motion notch in the woofer's output (fig.4, blue trace), which is when the back pressure from the port resonance holds the woofer cone still, lies close to that frequency, at 57Hz. The port's output (fig.4, red trace) peaks between 40Hz and 90Hz and its upper-frequency rolloff is relatively clean, though there is some low-level liveliness between 500Hz and 1kHz.


Footnote 1: EPDR is the resistive load that gives rise to the same peak dissipation in an amplifier's output devices as the loudspeaker. See "Audio Power Amplifiers for Loudspeaker Loads," JAES, Vol.42 No.9, September 1994, and www.stereophile.com/reference/707heavy/index.html.
Fig.1 Bowers & Wilkins 705 Signature with port open, electrical impedance (solid) and phase (dashed) (2 ohms/vertical div.).
Fig.2 Bowers & Wilkins 705 Signature with port closed, electrical impedance (solid) and phase (dashed) (2 ohms/vertical div.).
The traces in figs.1 & 2 are free from the small discontinuities that would imply resonances of some kind. However, when I investigated the enclosure's vibrational behavior with a plastic-tape accelerometer, I found a strong resonant mode at 516Hz on the sidewalls and top panel (fig.3). This mode has a high Q (Quality Factor), which, in combination with the relatively high frequency, might work against it having audible consequences.
Fig.3 Bowers & Wilkins 705 Signature, cumulative spectral-decay plot calculated from output of accelerometer fastened to center of side panel (MLS driving voltage to speaker, 7.55V; measurement bandwidth, 2kHz).
Fig.4 Bowers & Wilkins 705 Signature, acoustic crossover on tweeter axis at 50", corrected for microphone response, with the nearfield responses of the woofer (blue) and port (red), respectively plotted below 300Hz and 1kHz.
Higher in frequency in fig.4, the woofer's farfield response on the tweeter axis is fairly even before it crosses over to the tweeter (green trace) at 3kHz. The crossover slopes seem to be low order, ie, fairly shallow, but the woofer's rolloff above 3kHz is well-behaved. The tweeter has a little too much energy in the octave above 6kHz, with a subsequent dip in its output just below 20kHz. The 705 Signature's farfield response, taken without the grille and averaged across a 30° horizontal window centered on the tweeter axis, is shown as the black trace above 300Hz in fig.5. The balance is nicely flat and even up to 3kHz, with then a slight dip between 3kHz and 6kHz and up to 5dB too much energy in the high treble. Repeating the measurement with the vestigial grille covering the woofer in place gave an identical result.
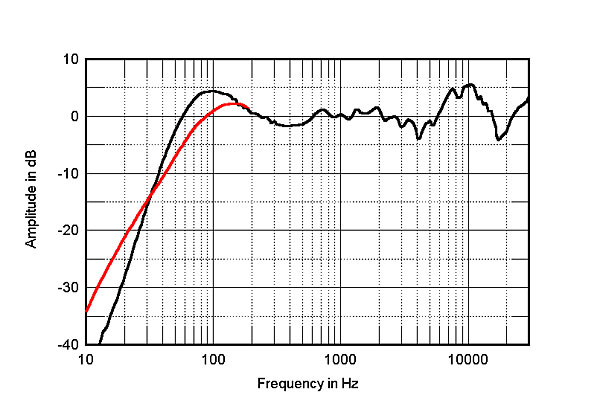
Fig.5 Bowers & Wilkins 705 Signature, anechoic response on tweeter axis at 50", averaged across 30° horizontal window and corrected for microphone response, with the complex sum of the nearfield woofer and port responses plotted below 300Hz (black) and the nearfield response of the woofer with the port blocked plotted below 200Hz (red).
The black trace below 300Hz in fig.5 is the complex sum of the nearfield woofer and port responses, with the latter compensating for the fact that the port is on the rear panel. There is the usual peak in the upper bass, which is almost entirely due to the nearfield measurement technique. The B&W's ported woofer tuning is maximally flat, in textbook manner. With the port fully blocked, the woofer's output (fig.5, red trace) rolls off below the upper bass with a 12dB/octave slope.
Fig.6 shows the 705 Signature's horizontal dispersion, normalized to the response without the grille on the tweeter axis, which thus appears as a straight line. The loudspeaker's radiation pattern narrows a little at the top of the woofer's passband and in the tweeter's second octave. Other than those issues, the contour lines in this graph are relatively evenly spaced. In the vertical plane (fig.7), again with the off-axis response normalized to the tweeter-axis response, the small dip just above the presence region flattens out 5°–10° below the tweeter axis. A major suckout in the crossover region develops 5° above the tweeter axis, however. As I found in my auditioning, the 705 Signature must be used with stands that place the tweeter axis just above the listener's ears to get the smoothest mid-treble response.
Fig.6 Bowers & Wilkins 705 Signature, lateral response family at 50", normalized to response on tweeter axis, from back to front: differences in response 90–5° off axis, reference response, differences in response 5–90° off axis.
Fig.7 Bowers & Wilkins 705 Signature, vertical response family at 50", normalized to response on tweeter axis, from back to front: differences in response 45–5° above axis, reference response, differences in response 5–45° below axis.
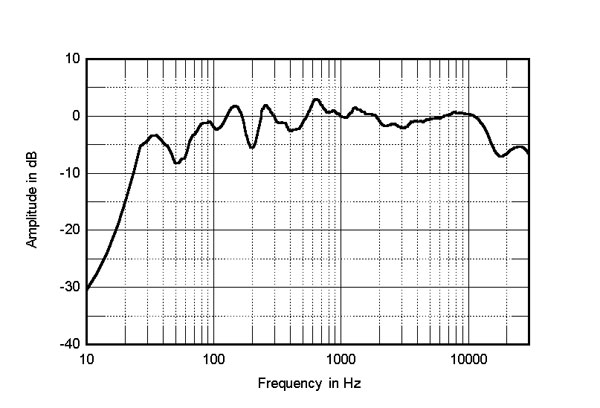
Fig.8 shows the B&W 705 Signatures' spatially averaged response in my room, generated by averaging 20 1/6-octave–smoothed spectra, taken for the left and right speakers individually using a 96kHz sample rate, in a vertical rectangular grid 36" wide by 18" high and centered on the positions of my ears. This tends to average out the peaks and dips below 400Hz that are due to the room's resonant modes. While the low bass gets some reinforcement from the lowest frequency mode in my room, the midbass region is shelved down a little. A loudspeaker that offers a flat on-axis response and well-controlled lateral dispersion gives a gently sloped-down treble in the spatially averaged room response, due to the increased absorption of the room's furnishings at high frequencies. By that criterion, the 705 Signature produces too much energy in-room between 6kHz and 11kHz. The responses at the listening position of the left and right 705 Signatures were closely matched above 1kHz.
Fig.8 Bowers & Wilkins 705 Signature, spatially averaged, 1/6-octave response in JA's listening room.
The excess of high-treble energy can also be seen in fig.9, which compares the B&W's spatially averaged response (red trace) with that of the Marten Oscar Duo, which Michael Fremer reviewed in November 2020 (blue trace), and that of the KEF LS50 that I reviewed in December 2012 (green trace). (The Martens were in the same positions as the B&Ws, the KEFs in similar positions.) The behavior of all three loudspeakers is very similar in the midrange, but the B&Ws have the most high-treble output, followed by the Martens, then the KEFs. The LS50s, however, have more presence-region output than either the Oscar Duos or 705 Signatures. At the other end of the spectrum, the Martens offer the best bass extension, with the B&Ws exciting the room's lowest-frequency resonance to a greater extent than the KEFs.
Fig.9 Bowers & Wilkins 705 Signature, spatially averaged, 1/6-octave response in JA's listening room (red), of the Marten Oscar Duo (blue), and of the KEF LS50 (green).
Turning to the time domain, the 705 Signature's step response on the tweeter axis (fig.10) reveals that the tweeter and woofer are both connected in positive acoustic polarity. The decay of the tweeter's step doesn't quite smoothly blend with the positive-going start of the woofer's step on this axis, which reinforces the implication in the vertical dispersion graph (fig.7) that the optimal blend of their outputs occurs just below the tweeter axis. Some ripples in the decay of the woofer's step correlate with a small amount of delayed energy just below 2kHz in the 705 Signature's cumulative spectral-decay plot (fig.11). Other than that, the B&W's waterfall plot is clean overall.
Fig.10 Bowers & Wilkins 705 Signature, step response on tweeter axis at 50" (5ms time window, 30kHz bandwidth).
Fig.11 Bowers & Wilkins 705 Signature, cumulative spectral-decay plot on tweeter axis at 50" (0.15ms risetime).
The Bowers & Wilkins 705 Signature offers generally excellent measured performance—better than that of the floorstanding 702 S2—though it is fair to note that the original 705 performed even better on the test bench.—John Atkinson
Footnote 1: EPDR is the resistive load that gives rise to the same peak dissipation in an amplifier's output devices as the loudspeaker. See "Audio Power Amplifiers for Loudspeaker Loads," JAES, Vol.42 No.9, September 1994, and www.stereophile.com/reference/707heavy/index.html.


