Sidebar 3: Measurements
I used DRA Labs' MLSSA system and a calibrated DPA 4006 microphone to measure the Bowers & Wilkins 802 D3 Diamond's frequency response in the farfield; I used an Earthworks QTC-40 for the nearfield frequency responses. (For logistical reasons, I measured a different sample from those auditioned by KR.) As with the Marten Coltrane 3, reviewed elsewhere in this issue, the 802 D3 was too bulky to be lifted off the ground. The earlier-than-usual reflections of the drive-units' output from the ground thus compromised the measurements' resolution in the midrange. The loudspeaker was also too heavy for me to lift it onto my Outline computer-controlled turntable, so I had to examine its off-axis behavior by manually rotating the loudspeaker on its casters and checking the angle with a protractor, a time-consuming procedure.
B&W specifies the 802 D3's sensitivity on the tweeter axis as a high 90dB/2.83V/m. My estimate was a little higher, at 91dB(B)/2.83V/m. This speaker will play loud for very little input voltage! However, it is a relatively demanding load for an amplifier to drive. Fig.1 shows the B&W's electrical impedance (solid trace) and phase (dotted trace). The magnitude drops to 3 ohms between 100 and 130Hz, and again between 670 and 770Hz; and while the electrical phase angle is low in the lower region, it becomes increasingly inductive above 600Hz, reaching +46° at 1kHz, where the magnitude is 4 ohms. There is also a combination of 4 ohms and –64° at 69Hz, implying that this speaker does require an amplifier that is not upset by a low effective impedance.
 The saddle centered on 20Hz in the impedance-magnitude trace suggests that this is the tuning frequency of the large, flared port that fires downward from the woofer enclosure. This was confirmed by the fact that the summed output of the two woofers (fig.2, blue trace) has the expected minimum-motion notch at this frequency. (The two woofers offered identical measured responses.) The port's output (red trace) peaks between 10 and 40Hz, but has a significant peak at 248Hz in its upper-frequency output. Though this resonance does result in a small discontinuity in the woofers' nearfield response, the fact that the port faces the floor should minimize its audible consequences.

 In the vertical plane (fig.5), a suckout in the upper crossover region develops immediately above the tweeter axis. Below that axis, which is a high 46.5" from the floor, the mid-treble region becomes a little boosted compared with the region below.


Fig.1 B&W 802 D3 Diamond, electrical impedance (solid) and phase (dashed) (2 ohms/vertical div.).
My accelerometer was out of action when I had the B&W speaker in-house for measurement. However, listening to the woofer enclosure with a stethoscope while I drove the 802 D3 with a sinewave generator revealed the presence of low-level modes at 380 and 415Hz.
Fig.2 B&W 802 D3 Diamond, acoustic crossover on tweeter axis at 50", corrected for microphone response, with nearfield responses of midrange unit (green), woofers (blue), and port (red), respectively plotted below 500Hz, 350Hz, and 650Hz.
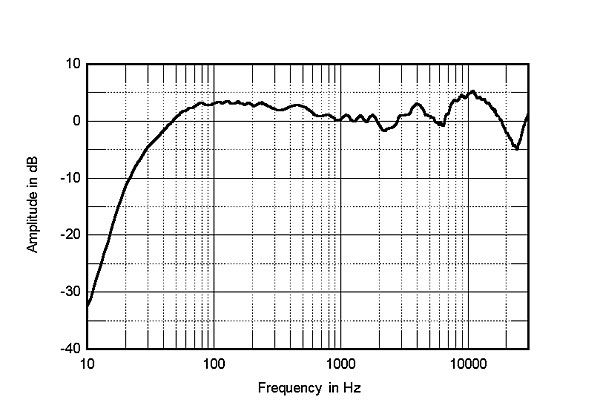
The woofers are crossed over to the midrange unit (fig.2, green trace) at around 500Hz, with steep filter slopes. The tweeter's output in this graph appears to be balanced a little too high in level, which persisted when I averaged the farfield response across a 30° horizontal window centered on the tweeter axis (fig.3). The 802 D3's midrange and bass output is smooth and even, and the slight boost in the mid- and upper bass is entirely an artifact of the nearfield measurement technique. As KR found, the 802 D3's low-frequency alignment is free from underdamped boom.
Fig.3 B&W 802 D3 Diamond, anechoic response averaged across 30° horizontal window on tweeter axis at 50", corrected for microphone response, with complex sum of midrange, woofer, and port responses plotted below 300Hz.
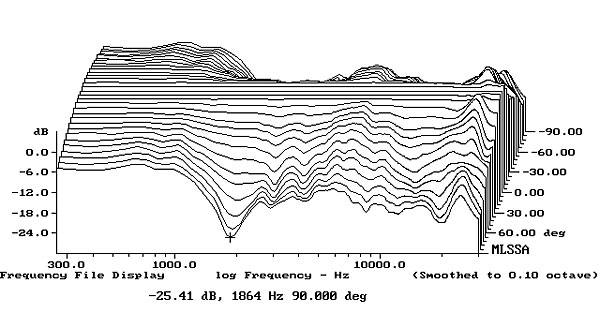
The plot of the B&W's lateral dispersion (fig.4) reveals that the tweeter becomes more directional than is usual in the top octaves, which in a typical room will work against the excess on-axis energy in the same region. But the output of the large-diameter midrange unit does drop off at the top of its passband more than 45° to the speaker's sides, which might make it sound a little polite. At more moderate off-axis angles, the contour lines in this graph are smooth and evenly spaced, which always correlates with precise, stable stereo imaging.
Fig.4 B&W 802 D3 Diamond, lateral response family at 50", normalized to response on tweeter axis, from back to front: differences in response 90–5° off axis, reference response, differences in response 5–90° off axis.
Fig.5 B&W 802 D3 Diamond, vertical response family at 50", normalized to response on tweeter axis, from back to front: differences in response 15–5° above axis, reference response, differences in response 5–10° below axis.
Turning to the time domain, the 802 D3's step response on the tweeter axis (fig.6) indicates that all four drive-units are connected with positive acoustic polarity, and that, in general, the decay of each unit's step blends smoothly with the start of that of the next unit lower in frequency. However, the output of the tweeter is very slightly too forward in time, which suggests that the B&W's optimal listening axis will be a little below the tweeter axis. The cumulative spectral-decay plot on the tweeter axis (fig.7) reveals a generally clean initial decay.
Fig.6 B&W 802 D3 Diamond, step response on tweeter axis at 50" (5ms time window, 30kHz bandwidth).
Fig.7 B&W 802 D3 Diamond, cumulative spectral-decay plot on midrange axis at 50" (0.15ms risetime).
Overall, the Bowers & Wilkins 802 D3 Diamond measures very well. I'm not surprised that Kal Rubinson liked it as much as he did.—John Atkinson


