Sidebar 3: Measurements
As with the Hegel Music Systems Mohican, which we reviewed in the May issue, the Bryston BCD-3 has no digital inputs of any kind. This limited my measurement of its technical behavior to using 16-bit test files burned to a CD-R. (I sometimes had to eject and reload a CD-R several times before the BCD-3 would play it.) I tested the Bryston with my Audio Precision SYS2722 system (see the January 2008 "As We See It").
The Bryston's error correction was excellent—no glitches were apparent in the player's output until the single gaps in the data spiral on the Pierre Verany Digital Test CD reached 2mm in length, or the closely spaced double gaps reached 1.5mm. (The Compact Disc standard, the so-called "Red Book," requires only that a player cope with gaps of up to 0.2mm.) The maximum output level from the unbalanced outputs was 2.02V; as expected, it was twice that value from the balanced outputs, at 4.05V. Both outputs preserved absolute polarity (ie, were non-inverting). The balanced output impedance was a low 143 ohms at 20kHz and 1kHz, rising inconsequentially to 160 ohms at 20Hz; the unbalanced impedance was 72 ohms at 20kHz and 1kHz, 77 ohms at 20Hz.
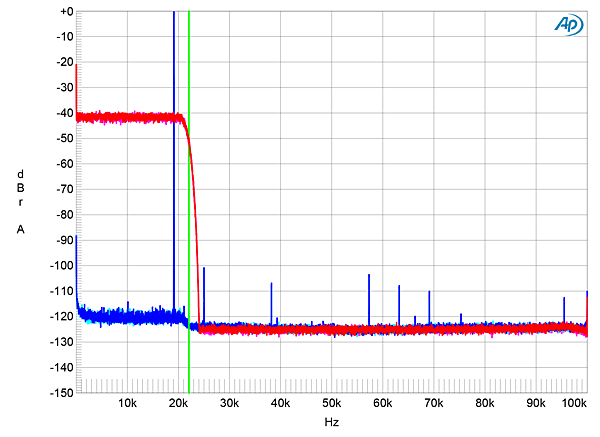
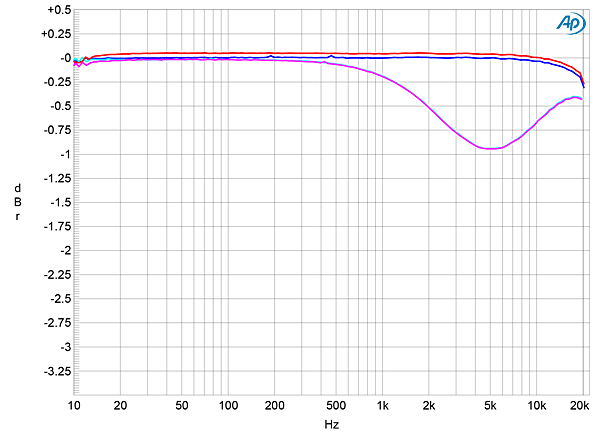
Fig.1 shows the BCD-3's impulse response; it's typical of a minimum-phase reconstruction filter, with all the ringing occurring after the single sample at 0dBFS. Tested with white noise sampled at 44.1kHz, the BCD-3's output rolled off quickly above 20kHz (fig.2, red and magenta traces), but hadn't reached full attenuation by the Nyquist frequency, 22.05kHz (fig.2, vertical green line). Nevertheless, the aliased image at 25kHz of a full-scale 19.1kHz tone (blue, cyan) is suppressed by 100dB. Note also how low the distortion harmonics of that tone are. The blue and red traces in fig.3 show the Bryston's audioband response taken with spot tones; it is flat, and reveals excellent channel matching. The cyan and magenta traces in this graph show the response with preemphasized data. The slight lack of energy in the mid-treble seems to be typical of modern CD players—the Hegel Mohican behaved identically (footnote 1), perhaps due to the fact that it uses the same AKM AK4490 DAC chip as the BCD-3.

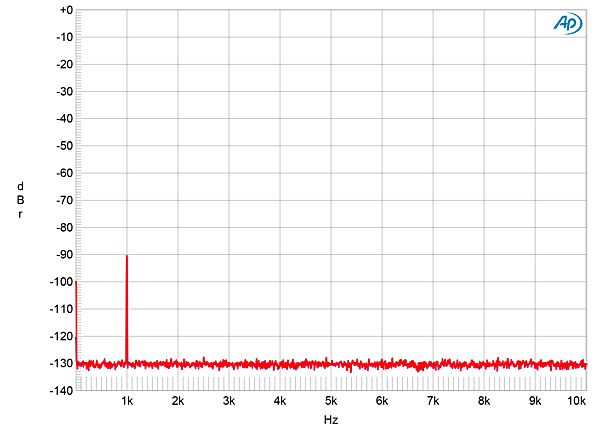
 Confirming the low distortion seen in fig.2, the spectrum of a full-scale 1kHz tone is very clean (fig.7), with just the third harmonic at 2kHz visible—and even then, it lies at –100dB (0.001%). I then tested for intermodulation distortion with an equal mix of 19 and 20kHz tones; the resultant spectrum looks hashy in the audioband (fig.8), but this is an artifact of the 16-bit encoding. Actual intermodulation products are very low in level even into 600 ohms, as are the aliased images at 24.1 and 25.1kHz.

 Finally, though there is a slight widening at the base of the spectral spike in fig.9 that represents the high-level tone at exactly one-quarter the sample rate, all the odd-order harmonics of the LSB-level, low-frequency squarewave lie at the correct levels, shown as the sloping green line. The BCD-3 offers excellent rejection of word-clock jitter.

Footnote 1: See fig.3 here.
Fig.1 Bryston BCD-3, impulse response (one sample at 0dBFS, 4ms time window).
Fig.2 Bryston BCD-3, wideband spectrum of white noise at –4dBFS (left channel red, right magenta) and 19.1kHz tone at 0dBFS (left blue, right cyan), with CD data (20dB/vertical div.).
Fig.3 Bryston BCD-3, frequency response at –12dBFS into 100k ohms, without deemphasis (left channel blue, right red) and with deemphasis (left cyan, right magenta) (0.5dB/vertical div.).
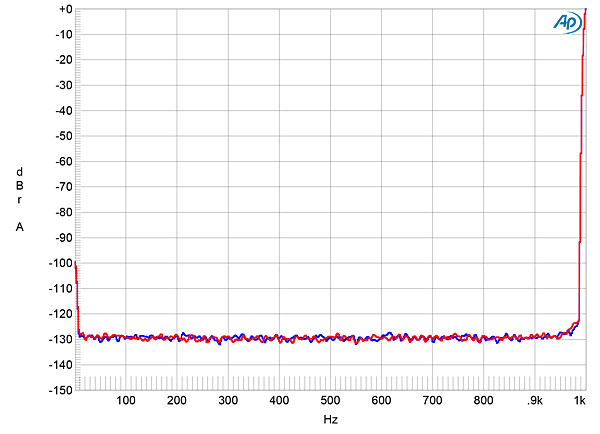
Channel separation (not shown) was superb, at >120dB above 200Hz, while the analog noise floor (fig.4) was both very low in level and free from any power-supply–related artifacts. Fig.5, the spectrum of the player's output while it played data representing a 1kHz tone at –90dBFS actually shows the low-frequency spectrum of the dither noise used to encode the 16-bit test signal. With undithered data representing a 1kHz tone at exactly –90.31dBFS, the Bryston's low self-noise allows the minimum-phase ringing on the waveform transitions to be clearly seen (fig.6). The three DC voltage levels described by the data are well defined.
Fig.4 Bryston BCD-3, spectrum with noise and spuriae of dithered 16-bit, 1kHz tone at 0dBFS (left channel blue, right red) (20dB/vertical div.).
Fig.5 Bryston BCD-3, spectrum with noise and spuriae of dithered 16-bit, 1kHz tone at –90dBFS (left channel blue, right red) (20dB/vertical div.).
Fig.6 Bryston BCD-3, waveform of undithered 16-bit, 1kHz sinewave at –90.31dBFS (left channel blue, right red).
Fig.7 Bryston BCD-3, spectrum of 1kHz sinewave, DC–1kHz, at 0dBFS into 100k ohms (left channel blue, right red; linear frequency scale).
Fig.8 Bryston BCD-3, HF intermodulation spectrum, DC–30kHz, 19+20kHz at 0dBFS into 600 ohms (left channel blue, right red; linear frequency scale).
Fig.9 Bryston BCD-3, high-resolution jitter spectrum of analog output signal, 11.025kHz at –6dBFS, sampled at 44.1kHz with LSB toggled at 229Hz: CD data (left channel blue, right red). Center frequency of trace, 11.025kHz; frequency range, ±3.5kHz.
This Bryston CD player's measured performance reveals superb audio engineering.— John Atkinson
Footnote 1: See fig.3 here.


