Sidebar 4: Measurements
I measured the Bryston BDA-3 with my Audio Precision SYS2722 system (see the January 2008 As We See It"). As well as the Audio Precision's digital outputs, I used WAV and AIFF test-tone files sourced via USB from my MacBook Pro running on battery power with Pure Music 3.0. Apple's USB Prober utility identified the Bryston DAC as "BDA3 Audio 2.0" from "Bryston," and revealed that its USB port operated in the optimal isochronous asynchronous mode. Apple's AudioMIDI utility revealed that, via USB, the BDA-3 accepted 24-bit integer data sampled at all rates from 44.1 to 384kHz. I didn't test the BDA-3 with HDMI, DSD, or Ethernet data.
The maximum output levels at 1kHz were as specified, at 4.05V balanced and 2.05V unbalanced. Both outputs preserved absolute polarity (ie, were non-inverting). The unbalanced output impedance was low, at 72 ohms at high and middle frequencies, increasing inconsequentially to 82 ohms in the low bass. The balanced output impedances were twice those values, as expected.
The impulse response with data sampled at 44.1kHz (fig.1) revealed that the digital reconstruction filter used by LG was a minimum-phase type, with all ringing occurring after the single sample at 0dBFS. Wideband analysis of the BDA-3's output while it reproduced 44.1kHz-sampled white noise at –4dBFS (footnote 1) indicated that this filter rolled off steeply above 20kHz, with the ultrasonic image at 25kHz of a full-scale 19.1kHz tone suppressed by more than 100dB (fig.2). Note that the distortion harmonics of that tone all lie at –104dB or lower (0.0006%). This DAC is superbly linear.


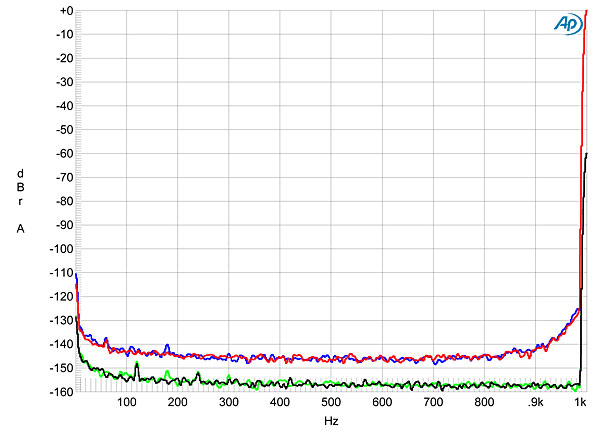
 Fig.4 shows spectral analysis of the BDA-3's noise floor with a 24-bit, 1kHz tone at 0dBFS (blue and red traces) and –60dBFS (green, gray). Other than a vanishingly small amount of 120Hz hum (at –147dB!), the spectra are free from spuriae. Note that, as the Bryston has such a low level of self-noise, I have increased the vertical scale in this graph from my usual –150 to –160dBFS, and have also done so for the spectra of the Bryston's output as it reproduced a dithered 1kHz tone with 16- and 24-bit AES/EBU data (fig.5). (The result was the same with USB data, fig.6.) The increase in bit depth drops the noise floor by almost 30dB, meaning that the BDA-3 offers close to 21-bit resolution—one of the best I have encountered. Note also that the spectra are free from any harmonic distortion.


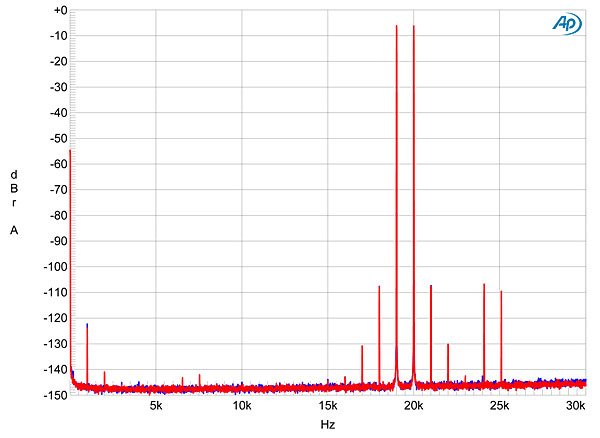
 All of the measurements so far were taken without upsampling. Repeating them with AES/EBU data and upsampling selected produced no differences. (The upsampling wasn't operative with USB data.) However, when I used an equal mix of 19 and 20kHz tones, sampled at 44.1kHz and with the peak level of the waveform reaching 0dBFS, the aliasing images of the two tones at 24.1 and 25.1kHz, which had been present without upsampling (fig.10), disappeared as expected when upsampling was selected (fig.11). And unlike with the upsampling function in Bryston's earlier BDA-1, the noise floor remained clean. Either way, actual intermodulation distortion was vanishingly low in level.
 Tested for its rejection of word-clock jitter using an AES/EBU connection and 16-bit J-Test data, the BDA-3's output was free from data-related spuriae, and all the odd-order harmonics of the low-frequency squarewave were at the correct levels (fig.12, green trace). With 24-bit data, the harmonics disappeared as expected and the noise floor was free from spuriae of any kind (fig.13).

 With its extremely low levels of noise, harmonic and intermodulation distortion, and its superb resolution, the Bryston BDA-3 offers measured performance that is as good as digital can get.—John Atkinson
Footnote 1: My thanks to Jürgen Reis of MBL for suggesting this test to me.
Fig.1 Bryston BDA-3, impulse response (one sample at 0dBFS, 44.1kHz sampling, 4ms time window).
Fig.2 Bryston BDA-3, wideband spectrum of white noise at –4dBFS (left channel red, right magenta) and 19.1kHz tone at 0dBFS (left blue, right cyan), with data sampled at 44.1kHz (20dB/vertical div.).
Fig.3, taken with data sampled at 44.1, 96, and 192kHz, is a more orthodox means of showing the Bryston's frequency response. With each sample rate, the BDA-3's output conforms to the same gentle rolloff above 10kHz, with the response down by just 0.25dB at 20kHz, but then a sharp rolloff just below half of each rate. With USB data sampled at 384kHz, the output was down by 6dB at the same 80kHz as with 192kHz data, but continued the gentle rolloff to reach –13dB at 120kHz. Channel separation was superb, at 125dB at 1kHz, and still 113dB at the top of the audioband.
Fig.3 Bryston BDA-3, frequency response at –12dBFS into 100k ohms with data sampled at: 44.1kHz (left channel green, right gray), 96kHz (left cyan, right magenta), 192kHz (left blue, right red), 384kHz (left green, right gray) (0.5dB/vertical div.).
Fig.4 Bryston BDA-3, spectrum with noise and spuriae of dithered 24-bit 1kHz tone at 0dBFS (left channel blue, right red) and –60dBFS (left green, right gray) (20dB/vertical div.).
Fig.5 Bryston BDA-3, spectrum with noise and spuriae of dithered 1kHz tone at –90dBFS with: 16-bit data (left channel cyan, right magenta), 24-bit data (left blue, right red) (20dB/vertical div.).
Fig.6 Bryston BDA-3, spectrum with noise and spuriae of dithered 1kHz tone at –90dBFS with 24-bit data via USB (left blue, right red) (20dB/vertical div.).
With its very low noise and correspondingly high resolution, the Bryston's reproduction of an undithered 16-bit/1kHz tone at exactly –90.31dBFS was essentially perfect (fig.7): The three DC voltage levels described by the data and the minimum-phase behavior of the reconstruction filter are clearly visible. With undithered 24-bit data, the result was an almost noise-free sinewave (fig.8), despite the very low signal level.
Fig.7 Bryston BDA-3, waveform of undithered 1kHz sinewave at –90.31dBFS, 16-bit data (left channel blue, right red).
Fig.8 Bryston BDA-3, waveform of undithered 1kHz sinewave at –90.31dBFS, 20-bit data (left channel blue, right red).
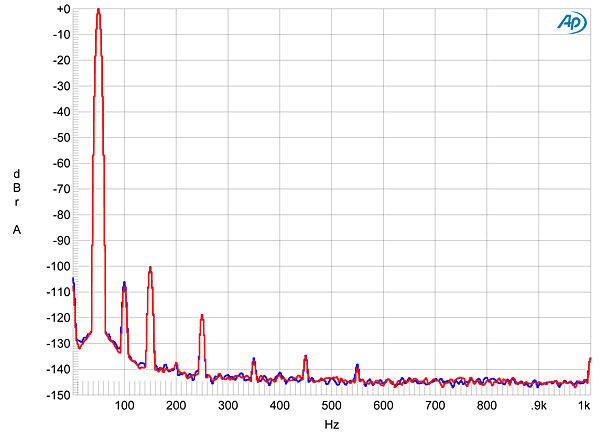
Fig.2, taken into a high 100k ohms, has already indicated that the BDA-3 offered a very low level of harmonic distortion; repeating the analysis with a full-scale low-frequency tone into a punishing 600 ohms confirmed that indication (fig.9). In fact, though the third harmonic is the highest in level, it still lies at just –100dB (0.001%).
Fig.9 Bryston BDA-3, spectrum of 50Hz sinewave, DC–1kHz, at 0dBFS into 600 ohms (left channel blue, right red; linear frequency scale).
Fig.10 Bryston BDA-3, HF intermodulation spectrum, DC–30kHz, 19+20kHz at 0dBFS into 100k ohms, 44.1kHz data (left channel blue, right red; linear frequency scale).
Fig.11 Bryston BDA-3 with upsampling, HF intermodulation spectrum, DC–30kHz, 19+20kHz at 0dBFS into 100k ohms, 44.1kHz data (left channel blue, right red; linear frequency scale).
Fig.12 Bryston BDA-3, high-resolution jitter spectrum of analog output signal, 11.025kHz at –6dBFS, sampled at 44.1kHz with LSB toggled at 229Hz: 16-bit AES/EBU data (left channel blue, right red). Center frequency of trace, 11.025kHz; frequency range, ±3.5kHz.
Fig.13 Bryston BDA-3, high-resolution jitter spectrum of analog output signal, 11.025kHz at –6dBFS, sampled at 44.1kHz with LSB toggled at 229Hz: 24-bit AES/EBU data (left channel blue, right red). Center frequency of trace, 11.025kHz; frequency range, ±3.5kHz.
Footnote 1: My thanks to Jürgen Reis of MBL for suggesting this test to me.


