Sidebar 3: Measurements
A few seconds after I first powered up Ken Micallef's review sample of the Edge A (serial no. HT C10972 6856 0020) it turned itself off, its front-panel light glowing red to indicate a fault. I suspect that, despite the protection afforded by the impressive packaging, the box had been dropped somewhere on its way to me. As Cambridge's Dominic Baker was visiting the company's US office, in Chicago, he stopped by my Brooklyn test lab on his way back to the UK with a second sample for me to measure (serial no. HT C10925 6853 0026).
This second sample of the Edge A passed its self-test routine, and I measured it using my Audio Precision SYS2722 system (see the January 2008 "As We See It"). Before performing any testing, I ran it at one-third power into 8 ohms. At the end of that period its heatsinks were hot, at 118.7°F (48.2°C), and its top panel was warm, at 93.9°F (34.4°C).
Looking first at the line-level analog inputs: With the volume control at its maximum setting, the voltage gain at 1kHz into 8 ohms measured 31.5dB from the speaker terminals for the balanced input, and 37.5dB for unbalanced signals. (This is unusual, as it is normal for the unbalanced inputs to offer 6dB lower gain.) The maximum gains from the headphone and preamp outputs were a respective 9.2 and 15.25dB. The line inputs preserved absolute polarity (ie, were non-inverting) from all outputs. The unbalanced input impedance was 46k ohms at low and middle frequencies, dropping slightly to 39.4k ohms at 20kHz. The balanced input impedance was 88k ohms at 20Hz and 1kHz, 83k ohms at 20kHz.
The headphone output impedance was a low 10.5 ohms at all audio frequencies. The output impedance at the speaker terminals (including cables) was 0.075 ohm at 20Hz and 1kHz, rising very slightly to 0.115 ohm at 20kHz. The response was flat into resistive loads (fig.1, blue, red, and green traces), rolling off above the audioband to reach –3dB above 200kHz, and any modulation of the frequency response with our standard simulated loudspeaker was within ±0.05dB (gray trace). Fig.1 was taken with the volume control set to its maximum; the response didn't change at lower settings of this control. The Cambridge's reproduction of a 10kHz squarewave (fig.2) was superbly square, with short risetimes, and no overshoot or ringing apparent.


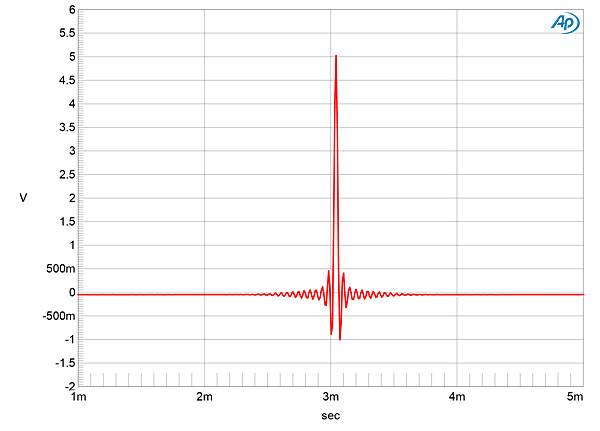
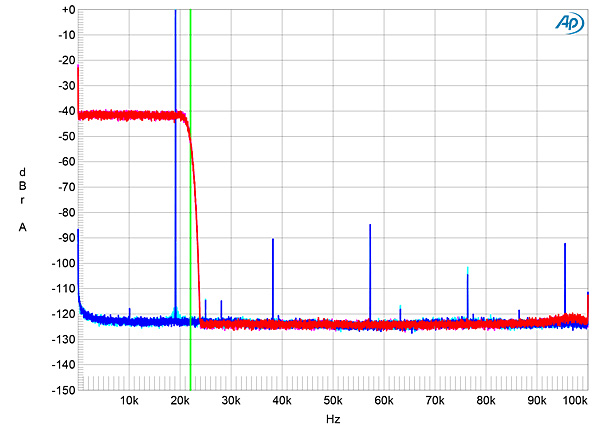
 The Cambridge's impulse response with 44.1kHz data (fig.12) indicates that its reconstruction filter is a conventional linear-phase type, with time-symmetrical ringing to either side of the single sample at 0dBFS. With 44.1kHz-sampled white noise (fig.13, red and magenta traces) the Edge A's response rolled off sharply above 20kHz, reaching full stop-band suppression just above the Nyquist frequency of 22.05kHz (green vertical line). An aliased image at 25kHz of a full-scale tone at 19.1kHz (blue and cyan traces) can be just seen at –115dB. The distortion harmonics of the 19.1kHz tone are visible above the ultrasonic noise floor, the highest in level being the third, at –84dB (0.006%).
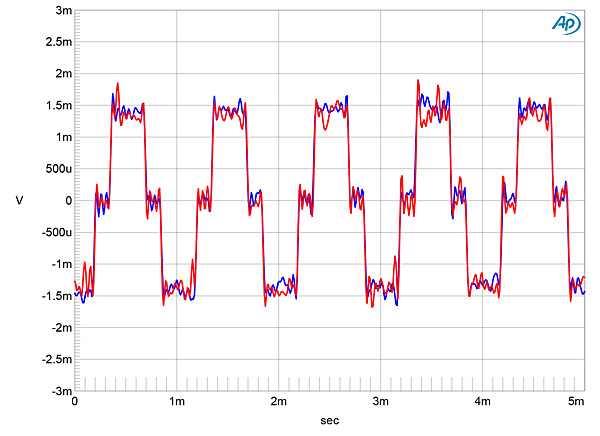
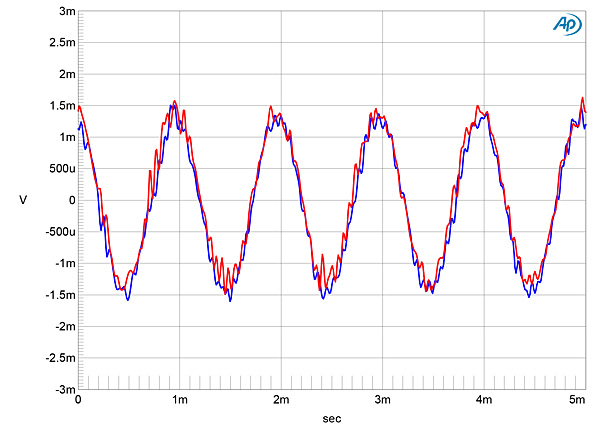
 When I examined the Edge A's digital frequency response with S/PDIF data at 44.1, 96, and 192kHz, the response followed the same basic shape, with a sharp rolloff just below the two lower sample rates (fig.14). When I increased the bit depth from 16 to 24 with a dithered 1kHz tone at –90dBFS (fig.15), the noise floor dropped by about 18dB, meaning that the Edge A offers around 18 bits' worth of resolution. With undithered data representing a tone at exactly –90.31dBFS (fig.16), the three DC voltage levels described by the data were well resolved and the waveform was perfectly symmetrical. With undithered 24-bit data, the result was a clean sinewave (fig.17).


 Overall, the Cambridge Edge A offers superb measured performance in both the analog and digital domains. (See also this issue's "As We See It.")—John Atkinson
Fig.1 Cambridge Edge A, analog input, frequency response at 2.83V into: simulated loudspeaker load (gray), 8 ohms (left channel blue, right red), 4 ohms (left cyan, right magenta), 2 ohms (green) (0.5dB/vertical div.).
Fig.2 Cambridge Edge A, analog input, small-signal, 10kHz squarewave into 8 ohms.
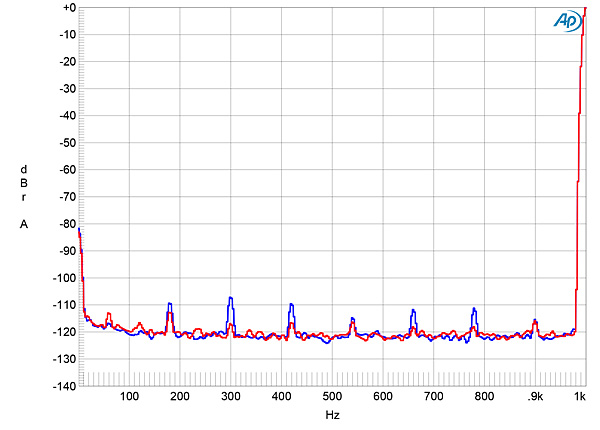
Channel separation was excellent, at >110dB in both directions below 2kHz, though this decreased to 80dB at 20kHz. With the analog inputs shorted to ground and the volume control set to its maximum, the wideband, unweighted signal/noise ratio (ref. 2.83V into 8 ohms) measured a superb 78.5dB. Restricting the measurement bandwidth to 22kHz increased the ratio to 91.6dB, and an A-weighting filter increased it further, to 94.3dB. (All ratios are the average of the two channels.) Levels of any residual spuriae at the AC power-line frequency and its harmonics were almost nonexistent in the right channel (fig.3, red trace), but some very low-level spurious tones can be seen in the left (blue).
Fig.3 Cambridge Edge A, analog input, spectrum of 1kHz sinewave, DC–1kHz, at 1W into 8 ohms (left channel blue, right red; linear frequency scale).
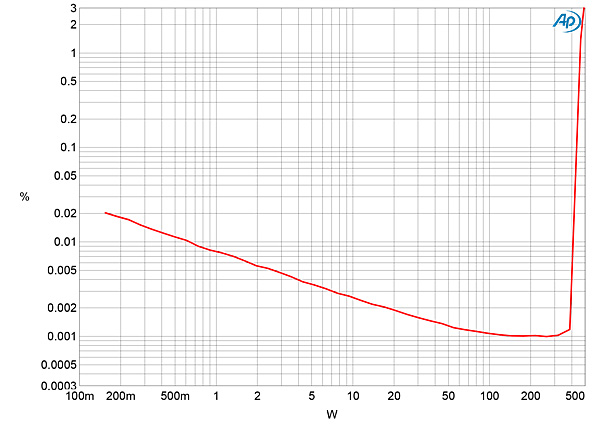
The Edge A is specified as delivering a maximum continuous output power of 100Wpc into 8 ohms (20dBW) or 200Wpc into 4 ohms (20dBW). At our usual definition of clipping (ie, when the percentage of THD+noise in the amplifier's output reaches 1%), with continuous drive in both channels the Cambridge exceeded its specification, delivering 145Wpc into 8 ohms (fig.4, 21.6dBW) and 230Wpc into 4 ohms (fig.5, 20.6dBW). With one channel driven, the Edge A clipped at 450W into 2 ohms (fig.6, 20.5dBW). The downward slope below 100W in these three graphs indicates that any distortion is actually below the already very low level of noise. Not only is this a very quiet amplifier, it is also a superbly linear one.
Fig.4 Cambridge Edge A, analog input, distortion (%) vs 1kHz continuous output power into 8 ohms, both channels driven.
Fig.5 Cambridge Edge A, analog input, distortion (%) vs 1kHz continuous output power into 4 ohms, both channels driven.
Fig.6 Cambridge Edge A, analog input, distortion (%) vs 1kHz continuous output power into 2 ohms, one channel driven.
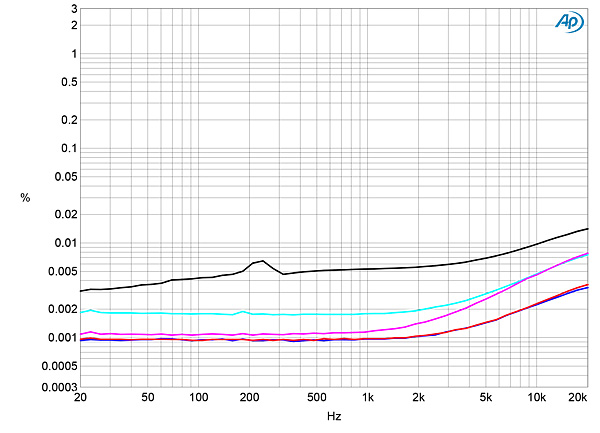
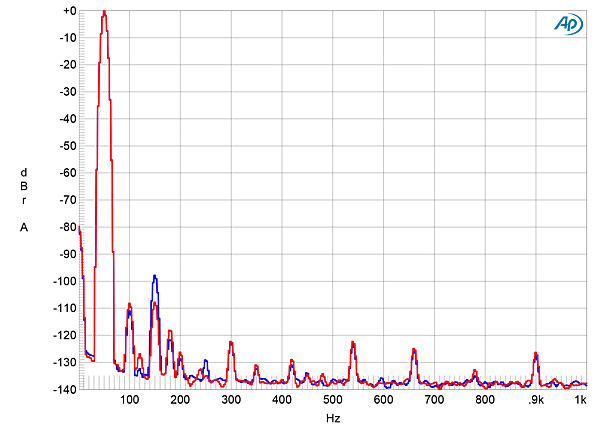
Distortion levels even at 4.6dB below the measured clipping power were very low, and were consistent with both frequency and load impedance, with just a slight rise in the top two audio octaves (fig.7). The shape of the spuriae waveform was obscured by noise (fig.8), and the distortion signature was almost nonexistent just below half-power into 8 ohms (fig.9). At the same voltage into 4 ohms, the third harmonic was the highest in level, at a still-low –99dB in the left channel (fig.10, blue trace) and –109dB in the right (red). Intermodulation distortion at high powers was also extremely low, even into 4 ohms (fig.11).
Fig.7 Cambridge Edge A, analog input, distortion (%) vs frequency at 20V into: 8 ohms (left channel blue, right red), 4 ohms (left cyan, right magenta), 2 ohms (gray).
Fig.8 Cambridge Edge A, analog input, 1kHz waveform at 50W into 8 ohms, 0.001% THD+N (top); distortion and noise waveform with fundamental notched out (bottom, not to scale).
Fig.9 Cambridge Edge A, analog input, spectrum of 50Hz sinewave, DC–1kHz, at 50Wpc into 8 ohms (left channel blue, right red; linear frequency scale).
Fig.10 Cambridge Edge A, analog input, spectrum of 50Hz sinewave, DC–1kHz, at 100Wpc into 4 ohms (left channel blue, right red; linear frequency scale).
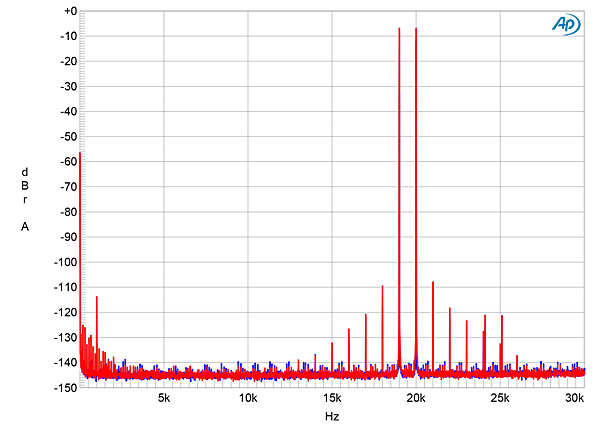
Fig.11 Cambridge Edge A, analog input, HF intermodulation spectrum, DC–30kHz, 19+20kHz at 100Wpc peak into 4 ohms (left channel blue, right red; linear frequency scale).
Turning to the digital inputs, the Cambridge's coaxial and optical S/PDIF inputs locked to datastreams with all sample rates up to 192kHz, and preserved absolute polarity. Apple's USB Prober utility identified the Edge A as "CA Edge 2.0" from "CA," and confirmed that its USB port operated in the optimal isochronous asynchronous mode. The AudioMIDI utility revealed that the Edge A's USB port could handle 16- and 24-bit integer data at all sample rates up to 705.6kHz. A 1kHz digital signal at –20dBFS resulted in an output level of 14.4V into 8 ohms with the volume control at its maximum setting, which suggests that the digital inputs have about 12dB too much gain; ie, a digital signal at –8dB with the volume control up full will just drive the amplifier into clipping into 8 ohms.
Fig.12 Cambridge Edge A, digital input, impulse response (one sample at 0dBFS, 44.1kHz sampling, 4ms time window).
Fig.13 Cambridge Edge A, digital input, wideband spectrum of white noise at –4dBFS (left channel red, right magenta) and 19.1kHz tone at 0dBFS (left blue, right cyan), with data sampled at 44.1kHz (20dB/vertical div.).
Fig.14 Cambridge Edge A, digital input, frequency response at –12dBFS into 100k ohms with data sampled at: 44.1kHz (left channel green, right gray), 96kHz (left cyan, right magenta), 192kHz (left blue, right red) (1dB/vertical div.).
Fig.15 Cambridge Edge A, digital input, spectrum with noise and spuriae of dithered 1kHz tone at –90dBFS with: 16-bit data (left channel cyan, right magenta), 24-bit data (left blue, right red) (20dB/vertical div.).
Fig.16 Cambridge Edge A, waveform of undithered 1kHz sinewave at –90.31dBFS, 16-bit TosLink data (left channel blue, right red).
Fig.17 Cambridge Edge A, waveform of undithered 1kHz sinewave at –90.31dBFS, 24-bit TosLink data (left channel blue, right red).
Intermodulation distortion via the Edge A's digital inputs was extremely low (fig.18). When I tested the digital inputs' rejection of word-clock jitter with 16-bit J-Test data, the odd-order harmonics of the LSB-level, low-frequency squarewave were all at the correct levels (fig.19, sloping green line), and no other sidebands can be seen. With 24-bit J-Test data, the resultant spectrum was superbly clean (fig.20).
Fig.18 Cambridge Edge A, digital input, HF intermodulation spectrum, DC–30kHz, 19+20kHz at 0dBFS into 100k ohms, 44.1kHz data (left channel blue, right red; linear frequency scale).
Fig.19 Cambridge Edge A, digital input, high-resolution jitter spectrum of analog output signal, 11.025kHz at –6dBFS, sampled at 44.1kHz with LSB toggled at 229Hz: 16-bit TosLink data (left channel blue, right red). Center frequency of trace, 11.025kHz; frequency range, ±3.5kHz.
Fig.20 Cambridge Edge A, digital input, high-resolution jitter spectrum of analog output signal, 11.025kHz at –6dBFS, sampled at 44.1kHz with LSB toggled at 229Hz: 24-bit TosLink data (left channel blue, right red). Center frequency of trace, 11.025kHz; frequency range, ±3.5kHz.


