Sidebar 3: Measurements
I measured the Cary SLI-100 amplifier using my Audio Precision SYS2722 system (see the January 2008 "As We See It"). Before doing so, I installed all the tubes, following the guide in the excellent manual, and checked the bias current for the KT150 output tubes. Each channel measured close to the recommended 75mA. I ran a 1kHz tone through the amplifier at 1Wpc into 8 ohms, then rechecked the bias before starting the testing. I checked the bias currents several times while performing the measurements, but neither channel had drifted by more than a few milliamps. I took complete sets of measurements from both the 4 and 8 ohm output-transformer taps.
The SLI-100 is specified as having an input sensitivity of 450mV for full power; ie, a voltage gain of 36dB, though the maximum gain quoted in the manual is 34dB. Measured from the 8 ohm tap into 8 ohms, the voltage gain measured 31.7dB; from the 4 ohm tap it was lower, as expected, at 30.3dB. Both output taps preserved absolute polarity (ie, were non-inverting). The input impedances varied from 61k ohms at 20Hz to 70k ohms at 1kHz and 51k ohms at 20kHz.
The headphone output offered a maximum gain of 28dB, a low output impedance of 6.4 ohms from 20Hz to 20kHz, and was also non-inverting. Examined at the speaker terminals, the SLI-100's output impedance from the 8 ohm tap was high, at 4.4 ohms at 20Hz and 1kHz, and 4.2 ohms at 20kHz. It was lower from the 4 ohm tap, at 2.3 ohms from 20Hz to 20kHz. The modulation of the Cary's frequency response with the 4 ohm tap driving our standard simulated loudspeaker was ±1.3dB (fig.1, gray trace), and a very audible ±2.2dB from the 8 ohm tap (fig.2). A peak at 150kHz, perhaps from the output transformer's secondary winding, can be seen in figs.1 and 2, but its amplitude decreased both as the load impedance dropped and at lower settings of the volume control (fig.3). This peak is associated with a slight degree of overshoot and three damped cycles of ringing with a 10kHz squarewave (fig.4).


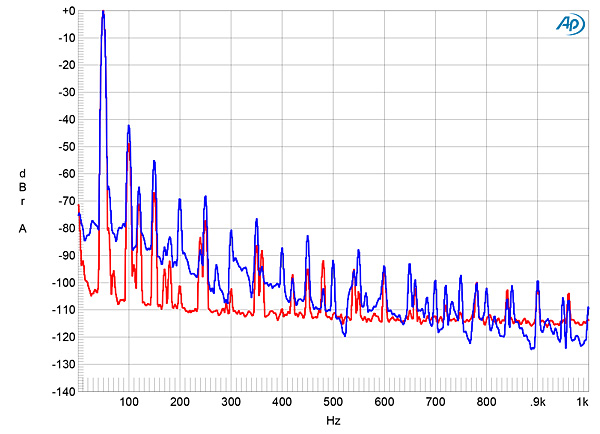
 The SLI-100 produced high levels of distortion even at low powers. Fortunately, its distortion signature is predominantly the subjectively benign second harmonic (fig.12). However, spectral analysis of the Cary's output while driving 50Hz at 1Wpc into 8 ohms from the 4 ohm tap (fig.13) revealed that higher-order harmonics are present, albeit at lower levels. Tested with an equal mix of 19 and 20kHz tones with the signal peaking at 1Wpc into 4 ohms from the 4 ohm tap, the difference product at 1kHz lay below –50dB (0.3%) (fig.14), but higher-order products were lower in level.

 It's always possible, of course, that this sample had a manufacturing fault, but Stereophile's policy is to audition and measure products as supplied for review.—John Atkinson
Footnote 1: See figs.6–8 here.
Fig.1 Cary SLI-100, volume control at maximum frequency response from 4 ohm tap at 2.83V into: simulated loudspeaker load (gray), 8 ohms (left channel blue, right red), 4 ohms (left cyan, right magenta), 2 ohms (green) (1dB/vertical div.).
Fig.2 Cary SLI-100, volume control at maximum frequency response from 8 ohm tap at 2.83V into: simulated loudspeaker load (gray), 8 ohms (left channel blue, right red), 4 ohms (left cyan, right magenta), 2 ohms (green) (1dB/vertical div.).
Fig.3 Cary SLI-100, volume control at –20dB from 4 ohm tap at 2.83V into 8 ohms (left channel blue, right red) (1dB/vertical div.).
Fig.4 Cary SLI-100, 8 ohm tap, small-signal 10kHz squarewave into 8 ohms.
Channel separation was good, but asymmetrical, at 66dB at 1kHz, R–L, but 83dB, L–R, decreasing to 41 and 57dB at the top of the audioband. The left channel was also noisier than the right: the unweighted, wideband signal/noise ratio, taken with the inputs shorted to ground and the volume control set to its maximum, was a good 69.5dB in the right channel but 59dB in the left. With an A-weighting filter in circuit, these S/N ratios improved to 76dB left and 81.4dB right. I'd noticed the trace for the left channel bouncing on the oscilloscope screen, and spectral analysis of the low-frequency noise floor (fig.5) showed that while a power-supply–related harmonic, 120Hz, is present at –64dB in both channels, the left (blue trace) had a much higher level of low-frequency noise than the right (red). This suggests that a tube in that channel was beginning to fail.
Fig.5 Cary SLI-100, 8 ohm tap, spectrum of 1kHz sinewave, DC–1kHz, at 1W into 8 ohms (left channel blue, right red; linear frequency scale).
Cary specifies the SLI-100 as offering 100Wpc (20dBW into 8 ohms). Defining clipping as when the THD+noise in the output reaches 1%, my measurements of the SLI-100's clipping power were much lower than this. Into 8 ohms from the 8 ohm tap (fig.6), the THD+N percentage in the left channel's output rose linearly with frequency, reaching 3.2W (5dBW) at 1% THD+N and 22W (13.4dBW) at 3%, reaching its specified power at 10% THD+N! The picture was even worse from the 8 ohm tap into 4 ohms (fig.7), with just 1.2W available at 1% THD+N. Alarmed by this behavior, I repeated these measurements with the right channel, only to get the same results. The 4 ohm tap delivered more power at 1% THD+N into both 8 ohms (fig.8) and 4 ohms (fig.9), but the power at 10% THD+N was lower into 8 ohms, at 72W (18.6dBW) and 103W into 4 ohms (17.1dBW).
Fig.6 Cary SLI-100, distortion (%) vs 1kHz continuous output power from 8 ohm tap into 8 ohms.
Fig.7 Cary SLI-100, distortion (%) vs 1kHz continuous output power from 8 ohm tap into 4 ohms.
Fig.8 Cary SLI-100, distortion (%) vs 1kHz continuous output power from 4 ohm tap into 8 ohms.
Fig.9 Cary SLI-100, distortion (%) vs 1kHz continuous output power from 4 ohm tap into 4 ohms.
Examining how the SLI-100's percentage of THD+N varied with frequency at 2.83V (equivalent to 1W into 8 ohms and 2W into 4 ohms), I found that the two channels behaved similarly in the top octave, with a small rise in the THD+N percentage (fig.10). At low frequencies, however, the right channel (red and magenta traces) had higher distortion than the left (blue, cyan). This graph was taken from the 4 ohm tap; at the same output voltage, the 8 ohm tap offered almost twice as much distortion (fig.11).
Fig.10 Cary SLI-100, 4 ohm tap, THD+N (%) vs frequency at 2.83V from 4 ohm tap into: 8 ohms (left channel blue, right red), 4 ohms (left cyan, right magenta).
Fig.11 Cary SLI-100, 4 ohm tap, THD+N (%) vs frequency at 2.83V from 8 ohm tap into: 8 ohms (left channel blue, right red), 4 ohms (left cyan, right magenta).
Fig.12 Cary SLI-100, 8 ohm tap, 1kHz waveform at 1W into 8 ohms, 0.57% THD+N (top); distortion and noise waveform with fundamental notched out (bottom, not to scale).
Fig.13 Cary SLI-100, spectrum of 50Hz sinewave, DC–1kHz, at 1W from 4 ohm tap into 8 ohms (left channel blue, right red; linear frequency scale).
Fig.14 Cary SLI-100, HF intermodulation spectrum, DC–30kHz, 19+20kHz at 1W peak from 4 ohm tap into 4 ohms (left channel blue, right red; linear frequency scale).
I was disappointed in the Cary Audio SLI-100's measured performance. Even if the higher level of low-frequency noise in the left channel could be fixed by replacing a tube, the levels of distortion at output powers above a few watts will be audible. I am not surprised that Herb Reichert wrote that Pass Laboratories' XA25 amplifier "tightened-up" the sound of a Stravinsky recording when compared with the Cary. HR also felt that this amplifier's sound quality had much in common with that of traditional single-ended tube amplifiers, which have similar levels of second-harmonic distortion due to a similarly curved transfer function. Interestingly, the shape of the THD+N percentage traces in figs.6–9 were similar to those of the Audio Research Reference 160M, which Jason Victor Serinus reviewed in October (footnote 1), which also uses KT150 output tubes. However, the levels of THD+N below actual clipping were 10 times higher.
Why wasn't Herb bothered by this behavior? First, second-harmonic distortion is consonant with music, comprising tones an octave higher than every spectral component, so doesn't tend to be heard as distortion unless very high in level and accompanied by intermodulation distortion. Second, Herb's room is fairly small, so I doubt he was asking the amplifier to deliver more than few watts at his preferred listening levels.
Footnote 1: See figs.6–8 here.


