Sidebar 3: Measurements
I measured the Devialet Expert 140 Pro using my Audio Precision SYS2722 system (see the January 2008 "As We See It"). The amplifier as received was set to "High Pass 10Hz, Max. Level 2.0V." I usually precondition amplifiers by running them at one-third power into 8 ohms for an hour, which is thermally the worst case for a class-AB output stage. As the Devialet has a (partly) digital output stage, the preconditioning wasn't necessary. Nevertheless, the amplifier ran warm, with the top panel measuring 119.9°F (48.9°C) an hour or so into the testing. The menu's internal temperature function indicated the message "Temp. A Amp 61°C; Temp. D Amp 57°C; Temp. Supply 65°C." The Expert 140 Pro should be positioned where it is well-ventilated.
As I always do with class-D amplifiers, I inserted an Audio Precision auxiliary AUX-0025 passive low-pass filter, which eliminates noise above 200kHz, between the test load. This eliminates the risk of driving the analyzer's input stage into slew-rate limiting, which would interfere with the distortion measurements. Without the Audio Precision filter, there was 120mV of ultrasonic noise present at the amplifier's outputs.
Looking first at the unbalanced line-level analog inputs, the Devialet's voltage gain into 8 ohms with the volume control set to its maximum of "30" was 48.5dB, which is a little higher than is usual for an integrated amplifier. The gain with the control set to "0.0" was exactly 30dB lower. The amplifier preserved absolute polarity (ie, was noninverting) with Phase set to "+." My measurements indicated an input impedance of a suitably high 16.5k ohms at 20Hz and 1kHz, this dropping inconsequentially to 15.7k ohms at 20kHz.
The output impedance is specified as an extraordinarily low 0.001 ohms. I measured a still-low 0.05 ohms from 20Hz to 20kHz, this figure including the series impedance of 6' of loudspeaker cable. As a result, the response with our standard simulated loudspeaker varied by less than ±0.05dB (fig.1, gray trace) and the response into 2 ohms (fig.1 green trace) was almost identical to that into 8 and 4 ohms (fig.1, blue, red, cyan, and magenta traces). As expected from the settings, the low-frequency response was –3dB at 10Hz. The output into 2 ohms (gray trace) was down by just 0.125dB at 20kHz.


 With the Devialet's volume control set to "0.0," a 1kHz digital signal at 0dBFS resulted in a level of 25.18V into 8 ohms from the speaker outputs. Increasing the volume control to "2.5" clipped the amplifier's output with this signal, so I performed most of the testing via the digital inputs with the volume control set to "0.0."
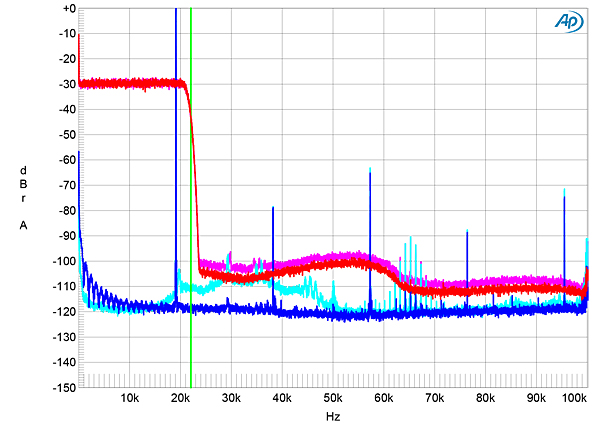
The 140 Pro's impulse response with 44.1kHz data was a typical linear-phase type, with symmetrical ringing before and after the single high sample (fig.10). With 44.1kHz-sampled white noise (fig.11, red and magenta traces), the Devialet's response reached full stop-band attenuation at 24kHz, though the noise floor with this signal was higher than it was with a full-scale tone at 19.1kHz (blue and cyan traces). The harmonics of the 19.1kHz tone can be seen in this graph, with the third the highest in level, at –63dB (0.07%). The 140 Pro's frequency responses with data at 44.1, 96, and 192kHz followed the same basic shape, but with a very sharp rolloff above half of each sample rate (fig.12).
With the Devialet's volume control set to "0.0," a 1kHz digital signal at 0dBFS resulted in a level of 25.18V into 8 ohms from the speaker outputs. Increasing the volume control to "2.5" clipped the amplifier's output with this signal, so I performed most of the testing via the digital inputs with the volume control set to "0.0."
The 140 Pro's impulse response with 44.1kHz data was a typical linear-phase type, with symmetrical ringing before and after the single high sample (fig.10). With 44.1kHz-sampled white noise (fig.11, red and magenta traces), the Devialet's response reached full stop-band attenuation at 24kHz, though the noise floor with this signal was higher than it was with a full-scale tone at 19.1kHz (blue and cyan traces). The harmonics of the 19.1kHz tone can be seen in this graph, with the third the highest in level, at –63dB (0.07%). The 140 Pro's frequency responses with data at 44.1, 96, and 192kHz followed the same basic shape, but with a very sharp rolloff above half of each sample rate (fig.12).


 Finally, tested for its rejection of word-clock jitter with 16-bit USB data, all the odd-order harmonics of the LSB-level, low-frequency squarewave were below the level of noise (fig.16; their correct levels are indicated by the sloping green line). However, a pair of sidebands at ±120Hz to the sides of the peak that represents the high-level tone at one-quarter the sample rate can be seen, these power supply-related. Note that I had to reduce the volume to "–24" to make this measurement, to avoid the amplifier going into protection.

Fig.1 Devialet Expert 140 Pro, frequency response at 2.83V into: 8 ohms (left channel blue, right red), 4 ohms (left cyan, right magenta), 2 ohms (green), and simulated loudspeaker (gray) (1dB/vertical div.).
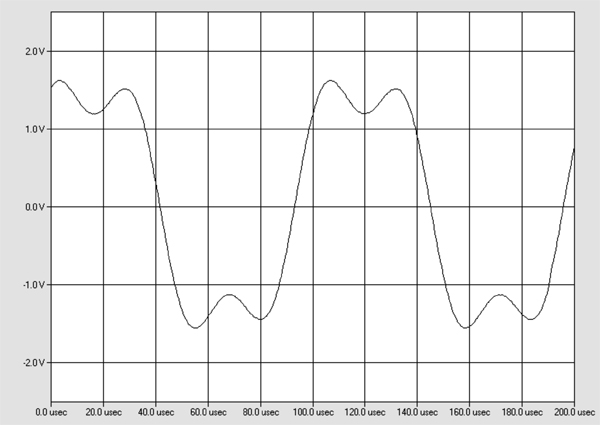
This graph was taken with the volume control set to "0.0" and neither the response nor the close channel-matching changed at different settings of the control. However, the Devialet amplifier's output rolls rapidly above 40kHz, and its reproduction of a 1kHz squarewave (fig.2) featured the symmetrical ringing indicative of a linear-phase digital filter. The 140 Pro digitizes its analog input with a sample rate of 96kHz—although the sample rate is said to be switchable between 96kHz and 192kHz, I wasn't able to change it from 96kHz—meaning that a 10kHz squarewave was reproduced with just the third harmonic at 30kHz present (fig.3).
Fig.2 Devialet Expert 140 Pro, small-signal, 1kHz squarewave into 8 ohms.
Fig.3 Devialet Expert 140 Pro, small-signal, 10kHz squarewave into 8 ohms.
Channel separation was good, at 90dB in both directions across most of the audioband, but when I looked at the crosstalk waveform on an oscilloscope, it was apparent that the measurement was dominated by noise. This higher-than-usual level of noise can be seen in fig.4, which shows a spectral analysis of the Devialet's low-frequency noise floor. While the individual FFT bins in this graph lie at or below –80dB, it suggests that the 140 Pro's analog inputs are limited to 14-bit resolution. With the filter, the wideband, unweighted S/N ratio, ref. 2.83V and measured with the volume control at "0.0" and the input shorted to ground, was 59.5dB, which improved to 68dB when A-weighted (average of both channels). The level of random noise increased as the volume control setting was raised above "0.0." The A-weighted ratio with the control set to "30," for example, measured 38.5dB, ie, 30.5dB worse.
Fig.4 Devialet Expert 140 Pro, spectrum of 1kHz sinewave, DC–1kHz, at 1W into 8 ohms with volume control set to "0.0" (left channel blue, right red) (linear frequency scale).
The Devialet's maximum power is specified as 140W into 6 ohms (19.7dBW). I don't have a 6 ohm test load, but with "clipping" defined as when the THD+noise reaches 1%, I found that the 140 Pro clipped at 103W into 8 ohms (20.1dBW, fig.5) and 205W into 4 ohms (20.1dBW, fig.6).
Fig.5 Devialet Expert 140 Pro, distortion (%) vs 1kHz continuous output power into 8 ohms.
Fig.6 Devialet Expert 140 Pro, distortion (%) vs 1kHz continuous output power into 4 ohms.
The Devialet's THD+N at full power is specified as just 0.0005%. The downward slope of the traces in figs.5 and 6 suggests that the measurement is actually just showing noise up to the point when the waveform starts to clip. (A constant level of background noise increases as a percentage as the signal level drops.) I haven't included a graph showing how THD+N percentage varies with frequency, therefore, as this graph would be dominated by noise. The waveform of the residual distortion and noise is just random noise (fig.7). But figs.5 and 6 indicate that the minimum THD+N percentage is just 0.02% into both 8 and 4 ohms.
Fig.7 Devialet Expert 140 Pro, 1kHz waveform at 50W into 8 ohms, 0.02% THD+N (top); distortion and noise waveform with fundamental notched out (bottom, not to scale).
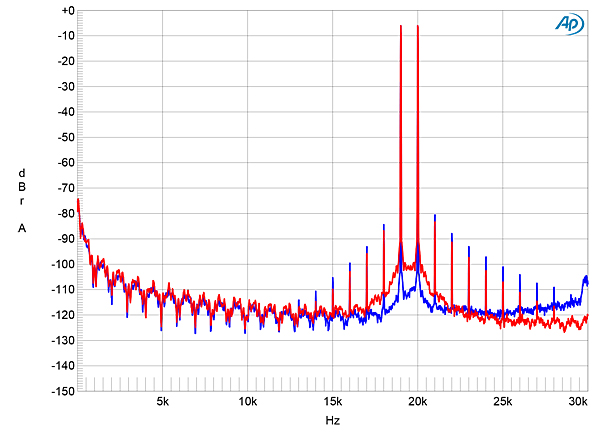
The spectrum of the Devialet's output while I drove a low-frequency tone at a moderately high power into 8 ohms is shown in fig.8; any distortion harmonics are below the level of random noise. I ran into problems when I tried to test for intermodulation distortion with my usual mix of 19kHz and 20kHz tones. The amplifier went into protection with sustained high-power, high-frequency tones, reducing the output level. The spectrum in fig.9 was taken at 8Wpc into 4 ohms, the highest power the amplifier would deliver continuously without its protection operating. Though the second-order difference product is absent, some low-level, high-order intermodulation products can be seen. However, the noise floor has an unusual scalloped appearance.
Fig.8 Devialet Expert 140 Pro, spectrum of 50Hz sinewave, DC–1kHz, at 33W into 8 ohms (left channel blue, right red) (linear frequency scale).
Fig.9 Devialet Expert 140 Pro, HF intermodulation spectrum, DC–30kHz, 19+20kHz at 8W peak into 4 ohms (left channel blue, right red) (linear frequency scale).
Turning to the digital inputs, Apple's USB Prober utility identified the Devialet amplifier as "Expert Pro USB Audio 2.0" from "DEVIALET" and indicated that the USB port operated in the optimal isochronous asynchronous mode. Apple's AudioMIDI utility revealed that, via USB, the 140 Pro accepted 16- and 24-bit integer data sampled at all rates from 44.1 to 192kHz. All the digital inputs preserved absolute polarity (ie, were noninverting).
Fig.10 Devialet Expert 140 Pro, digital inputs, impulse response (one sample at 0dBFS, 44.1kHz sampling, 4ms time window).
Fig.11 Devialet Expert 140 Pro, digital inputs, wideband spectrum of white noise at –4dBFS (left channel red, right magenta) and 19.1kHz tone at 0dBFS (left blue, right cyan) with data sampled at 44.1kHz (20dB/vertical div.).
Fig.12 Devialet Expert 140 Pro, digital inputs, frequency response at –20dBFS with data sampled at: 44.1kHz (left channel green, right gray), 96kHz (left channel cyan, right magenta), 192kHz (left blue, right red) (1dB/vertical div.).
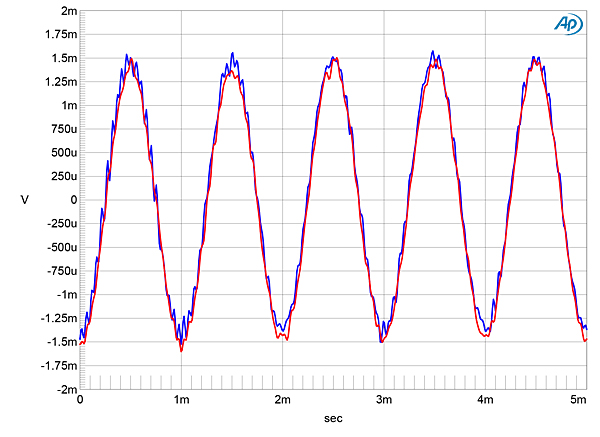
When I increased the bit depth from 16 to 24 with a dithered 1kHz tone at –90dBFS, the random noise floor dropped by >20dB in the left channel (fig.13, blue trace), meaning that the Devialet's digital inputs offer almost 20 bits' worth of resolution in this channel. However, the noise floor in the right channel (red trace) is higher than it is in the left and has an odd scalloped appearance. With undithered data representing a tone at exactly –90.31dBFS, the three DC voltage levels described by the data were well resolved and the waveform was perfectly symmetrical (fig.14). With undithered 24-bit data, the result was a superbly clean sinewave (fig.15).
Fig.13 Devialet Expert 140 Pro, digital inputs, spectrum with noise and spuriae of dithered 1kHz tone at –90dBFS with: 16-bit data (left channel cyan, right magenta), 24-bit data (left blue, right red) (20dB/vertical div.).
Fig.14 Devialet Expert 140 Pro, digital inputs, waveform of undithered 1kHz sinewave at –90.31dBFS, 16-bit data (left channel blue, right red).
Fig.15 Devialet Expert 140 Pro, digital inputs, waveform of undithered 1kHz sinewave at –90.31dBFS, 24-bit data (left channel blue, right red).
Fig.16 Devialet Expert 140 Pro, high-resolution jitter spectrum of analog output signal, 11.025kHz at –6dBFS, sampled at 44.1kHz with LSB toggled at 229Hz: 16-bit USB data (left channel blue, right red). Center frequency of trace, 11.025kHz; frequency range, ±3.5kHz.
In most respects, the Expert 140 Pro measures very similarly to the much- more-expensive Devialet D-Premier, which I reviewed favorably in January 2013. However, I was bothered by the higher-than-expected level of background noise—much higher than with the D-Premier—especially with the analog inputs.—John Atkinson


