Sidebar 3: Measurements
I used DRA Labs' MLSSA system and a calibrated DPA 4006 microphone to measure the Dutch & Dutch 8c's frequency response in the farfield and an Earthworks QTC40 mike for the nearfield responses. Before I took the measurements, I connected the speaker (serial no. 8c-515) to my network and accessed the control app at www.lanspeaker.com in order to defeat the settings Kal Rubinson had used during his auditioning. These were compensation for the distances to the room's front and side walls; the levels of treble and bass; and the two parametric filters he'd used to compensate for his room's low-frequency modes. I left the volume setting at –20dB, selected the "Analog Low Level (–10dBV)" input setting, and disconnected the speaker from my network. (The network connection is necessary only for setting the controls; the 8c is fully operational without it.)
As the 8c is an active loudspeaker, no sensitivity is specified. However, with a 1V RMS pink-noise signal, the 8c gave a B-weighted SPL of 84dB at 1m on the HF axis, which suggests that the speaker has plenty of gain in reserve.
When I investigated the enclosure's vibrational behavior with a plastic-tape accelerometer, I found a resonant mode at 363Hz on the centers of the side panels (fig.1), with another at 551Hz on the top. These modes were very low in level, however, and the 8c's enclosure felt reassuringly inert when I rapped it with my knuckles.

 I couldn't find a setting in the web menu to change the DSP sample rate, but to see if this was the case only with analog input data—ie, to see if the analog input's A/D converter runs only at 48kHz—I fed the speaker AES/EBU digital data sampled at 96kHz and repeated the on-axis frequency-response measurement. The result was the same: a sharp rolloff above 20kHz and a Nyquist frequency of 24kHz. As a final check, I set the 8c's analog subwoofer output to full range with the website app and analyzed its analog output signal while I fed the speaker 96kHz digital data. There was no difference. It appears that Dutch & Dutch's DSP operates at a fixed 48kHz sample rate, and that digital data with a higher sample rate are downsampled.
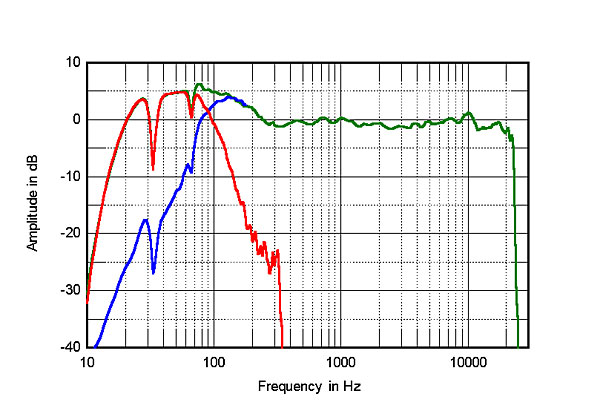
The blue trace below 300Hz in fig.2 shows the response of the 8c's front-panel midrange woofer measured in the nearfield. The upper-bass rise is due to the nearfield measurement technique, which assumes that the drive-units are mounted in a true infinite baffle—ie, one that extends to infinity in both the horizontal and vertical planes. The driver's output rolls off below 100Hz with what appears to be an 18dB/octave slope. The red trace is the nearfield output of the two subwoofers mounted on the 8c's rear panel, plotted in the ratio of the square roots of the woofer's and subwoofers' radiating areas. The subwoofers cover the range from 20Hz to 100Hz, with a steep rolloff below 20Hz. To my surprise, however, two sharp notches can be seen in this graph. I reconnected the speaker to the network and checked the controls with the website app. It turned out that I hadn't disabled Kal's parametric EQ settings, which included a 14.75dB-deep notch at 33Hz with a Quality factor (Q) of 10.1 and another notch at 66Hz, this one 5.75dB deep with a Q of 15.6. Turning off these filters gave the expected flat response.
The plot of the 8c's horizontal dispersion (fig.3) reveals that the speaker's directivity is very well controlled, the output to the sides falling off evenly with frequency up to 15kHz or so. The use of a woofer with a cardioid radiation pattern and a tweeter loaded with a waveguide gives an impressively consistent result. The reverberant power in the listening room will have a spectral balance not significantly different from the 8c's direct sound other than in the treble, where the room's furnishings are more absorbent than they are at lower frequencies. In the vertical plane (fig.4), the 8c maintains its even on-axis balance over a wide (±10°) window. The hint of a suckout between 1200 and 1500Hz 15° above the tweeter axis suggests that this is the region where the woofer crosses over to the tweeter—lower than usual for a 1" tweeter.
I couldn't find a setting in the web menu to change the DSP sample rate, but to see if this was the case only with analog input data—ie, to see if the analog input's A/D converter runs only at 48kHz—I fed the speaker AES/EBU digital data sampled at 96kHz and repeated the on-axis frequency-response measurement. The result was the same: a sharp rolloff above 20kHz and a Nyquist frequency of 24kHz. As a final check, I set the 8c's analog subwoofer output to full range with the website app and analyzed its analog output signal while I fed the speaker 96kHz digital data. There was no difference. It appears that Dutch & Dutch's DSP operates at a fixed 48kHz sample rate, and that digital data with a higher sample rate are downsampled.
The blue trace below 300Hz in fig.2 shows the response of the 8c's front-panel midrange woofer measured in the nearfield. The upper-bass rise is due to the nearfield measurement technique, which assumes that the drive-units are mounted in a true infinite baffle—ie, one that extends to infinity in both the horizontal and vertical planes. The driver's output rolls off below 100Hz with what appears to be an 18dB/octave slope. The red trace is the nearfield output of the two subwoofers mounted on the 8c's rear panel, plotted in the ratio of the square roots of the woofer's and subwoofers' radiating areas. The subwoofers cover the range from 20Hz to 100Hz, with a steep rolloff below 20Hz. To my surprise, however, two sharp notches can be seen in this graph. I reconnected the speaker to the network and checked the controls with the website app. It turned out that I hadn't disabled Kal's parametric EQ settings, which included a 14.75dB-deep notch at 33Hz with a Quality factor (Q) of 10.1 and another notch at 66Hz, this one 5.75dB deep with a Q of 15.6. Turning off these filters gave the expected flat response.
The plot of the 8c's horizontal dispersion (fig.3) reveals that the speaker's directivity is very well controlled, the output to the sides falling off evenly with frequency up to 15kHz or so. The use of a woofer with a cardioid radiation pattern and a tweeter loaded with a waveguide gives an impressively consistent result. The reverberant power in the listening room will have a spectral balance not significantly different from the 8c's direct sound other than in the treble, where the room's furnishings are more absorbent than they are at lower frequencies. In the vertical plane (fig.4), the 8c maintains its even on-axis balance over a wide (±10°) window. The hint of a suckout between 1200 and 1500Hz 15° above the tweeter axis suggests that this is the region where the woofer crosses over to the tweeter—lower than usual for a 1" tweeter.


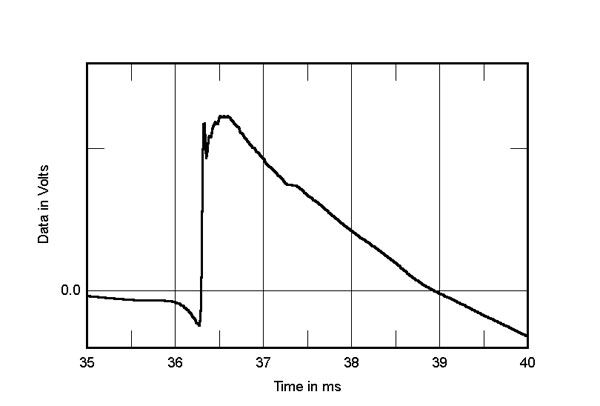
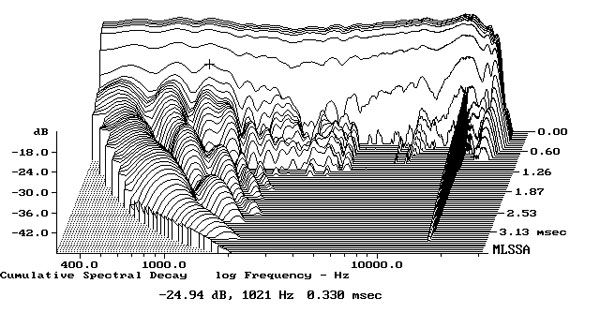
Fig.1 Dutch & Dutch 8C, cumulative spectral-decay plot calculated from output of accelerometer fastened to center of sidewall (measurement bandwidth, 2kHz).
The green trace above 200Hz in fig.2 shows the D&D speaker's farfield response with an analog input signal, averaged across a 30° horizontal window centered on the tweeter axis. The response is superbly flat, remaining within ±1.4dB limits from 200Hz to 15kHz! However, the output rolls off sharply above 20kHz, reaching full stop-band attenuation just above 24kHz. This suggests that the 8c's internal digital signal processing operates with a sample rate of 48kHz.
Fig.2 Dutch & Dutch 8C, anechoic response on tweeter axis at 50", averaged across 30° horizontal window and corrected for microphone response, with the nearfield woofer (blue) and subwoofer (red) responses and their complex sum (green), respectively plotted below 300Hz, 350Hz, and 300Hz.
Fig.3 Dutch & Dutch 8C, lateral response family at 50", normalized to response on tweeter axis, from back to front: differences in response 90–5° off axis, reference response, differences in response 5–90° off axis.
Fig.4 Dutch & Dutch 8C, vertical response family at 50", normalized to response on tweeter axis, from back to front: differences in response 15–5° above axis, reference response, differences in response 5–15° below axis.
In the time domain, the Dutch & Dutch 8c's step response (fig.5) reveals that the tweeter and woofer are connected in positive acoustic polarity, with DSP used to produce an almost perfectly time-coincident shape. However, the output of the subwoofers, which appear to be connected in negative polarity, starts just before the tweeter/woofer step. The 8c's cumulative spectral-decay plot (fig.6) is one of the cleanest I have measured, especially in the treble!
In summing up the Dutch & Dutch 8c's measured performance, all I can say is "Wow!"—John Atkinson
Fig.5 Dutch & Dutch 8C, step response on tweeter axis at 50" (5ms time window, 30kHz bandwidth).
Fig.6 Dutch & Dutch 8C, cumulative spectral-decay plot on tweeter axis at 50" (0.15ms risetime).


