Sidebar 3: Measurements
The Hafler 9500's input impedance measured just over 47k ohms. Gain into 8 ohms was 28dB. The output impedance was very low, ranging between 0.016 ohms and 0.022 ohms depending on frequency and load. This suggests a very consistent performance with a wide range of loudspeaker loads. DC offset measured 6.8mV in the left channel, 13.6mV in the right. S/N (unweighted at 1W into 8 ohms) measured 92.7dB. The 9500 was noninverting, a positive impulse at the input remaining positive at the output.
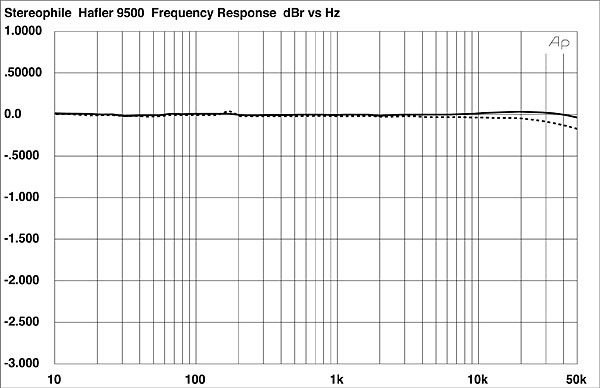
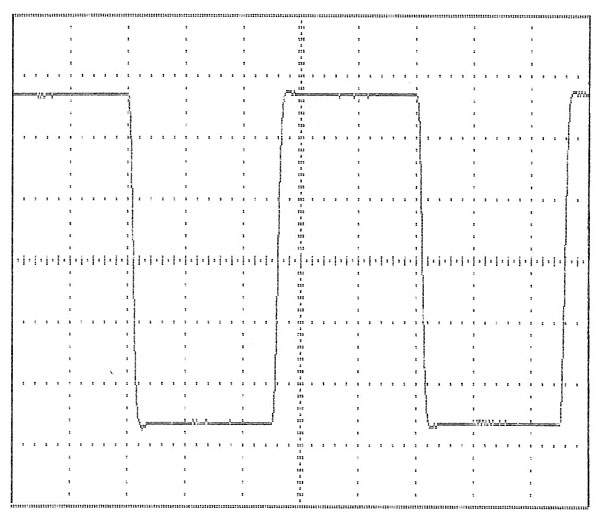
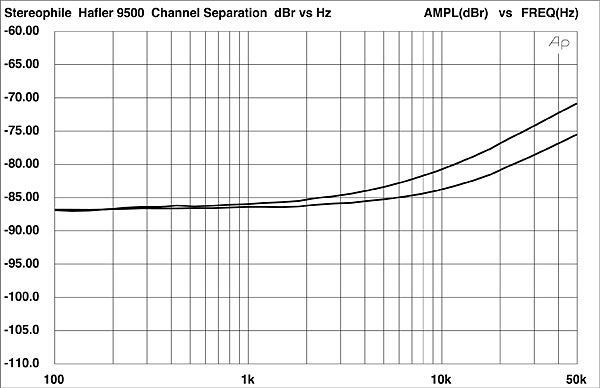
Fig.1 shows the frequency response of the 9500 at 2W into 4 ohms. Comment here is unnecessary. The response at 1W into 8 ohms is not shown; it is actually slightly better. The Hafler's 10kHz squarewave response is shown in fig.2. A very slight overshoot, well damped, is visible on the leading edge in both the positive and negative legs—a small price for the apparently very fast rise time indicating a wide bandwidth. The 1kHz squarewave (not shown) is virtually textbook-perfect. Fig.3 shows the crosstalk, measured at 1kHz; it is very low and consistent between channels.


 Finally, despite my previously expressed concerns for the life of our test-bench load resistors, I did check the power output of the 9500 in the bridged mode, into 8 ohms. This was done on a THD+noise vs level sweep—which is a bit easier on the amplifier and its fuses than discrete clipping measurements, as high power is sustained for less than a second. In this mode, 1kHz distortion remained under 0.02% from under 50mW up to 700W. Distortion rose rapidly above this point, but did not reach 1% until 900W or 29.5dBW! Again, nothing catastrophic occurred, either to the amplifier or to our test load.
Altogether, the Hafler 9500's measurements would not be out of place in a far more expensive amplifier. Nothing in the test-bench results contradicts the amplifier's fine performance in the listening room.—Thomas J. Norton
Finally, despite my previously expressed concerns for the life of our test-bench load resistors, I did check the power output of the 9500 in the bridged mode, into 8 ohms. This was done on a THD+noise vs level sweep—which is a bit easier on the amplifier and its fuses than discrete clipping measurements, as high power is sustained for less than a second. In this mode, 1kHz distortion remained under 0.02% from under 50mW up to 700W. Distortion rose rapidly above this point, but did not reach 1% until 900W or 29.5dBW! Again, nothing catastrophic occurred, either to the amplifier or to our test load.
Altogether, the Hafler 9500's measurements would not be out of place in a far more expensive amplifier. Nothing in the test-bench results contradicts the amplifier's fine performance in the listening room.—Thomas J. Norton
Fig.1 Hafler Transnova 9500, frequency response at 2W into 8 ohms (right channel dashed, 0.5dB/vertical div.).
Fig.2 Hafler Transnova 9500, 10kHz squarewave at 1W into 8 ohms.
Fig.3 Hafler Transnova 9500, Channel separation L–R (top), R–L (bottom) (5dB/vertical div.)
The THD+noise vs frequency results in fig.4 are consistently low regardless of load, slightly but not appreciably higher at the lower impedances. The commonly encountered distortion rise at higher frequencies is moderate, distortion still remaining below 0.1%.
Fig.4 Hafler Transnova 9500, THD+noise (%) vs frequency at, from bottom to top: 1W into 8 ohms (left), 2W into 4 ohms (left), 1W into 8 ohms (right), 2W into 4 ohms (right), 4W into 2 ohms (left).
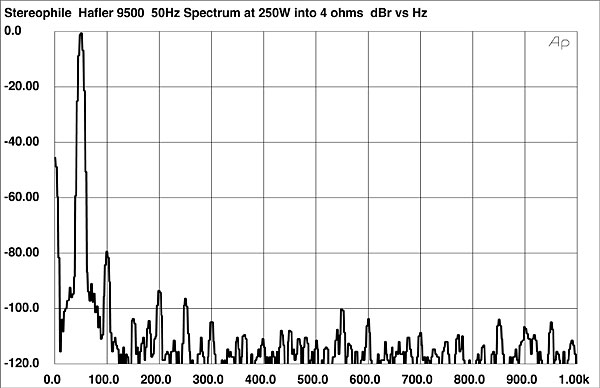
Fig.5 shows the THD+noise waveform of the Hafler in response to a 1kHz input into a 4 ohm load at an output of 41W, low outputs resulting in nothing but noise. It appears to be primarily a noisy second harmonic. A similar result was obtained into an 8 ohm load, but into a 2 ohm load a third harmonic component was evident (curves not shown). Fig.6 shows the spectrum of the Hafler's output driving 50Hz into a 4 ohm load at an output level of 250W (2/3 power). The distortion components here are well down in level—the worst case being the second harmonic at 100Hz—at –79dB, or about 0.012%.
Fig.5 Hafler Transnova 9500, 1kHz waveform at 41W into 4 ohms (top). distortion and noise waveform with fundamental notched out (bottom, not to scale).
Fig.6 Hafler Transnova 9500, spectrum of 50Hz, DC–1kHz, at 250W into 4 ohms (linear frequency scale).
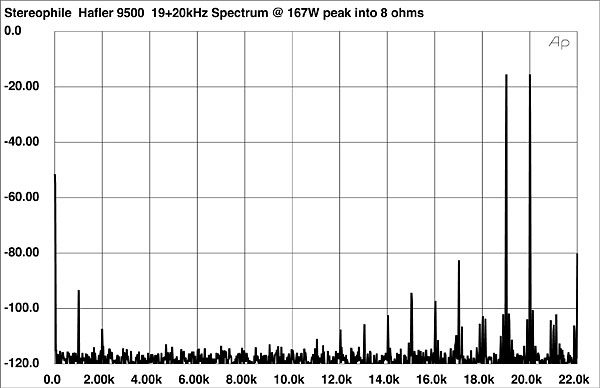
Fig.7 shows the artifacts (IM distortion) in response to a combined 19+20kHz signal at 230W output into 4 ohms (a level just below visible signs of clipping with this test signal). The highest artifact here—at 17kHz—is at –67dB, or about 0.045%. The 1kHz difference signal is at –78dB, or less than 0.015%. The response to the same signal into an 8 ohm load at 142W (not shown, but, again, just prior to clipping with this signal) had no artifacts above 0.025%.
Fig.7 Hafler Transnova 9500, HF intermodulation spectrum, DC–22kHz, at 230W into 4 ohms (linear frequency scale).
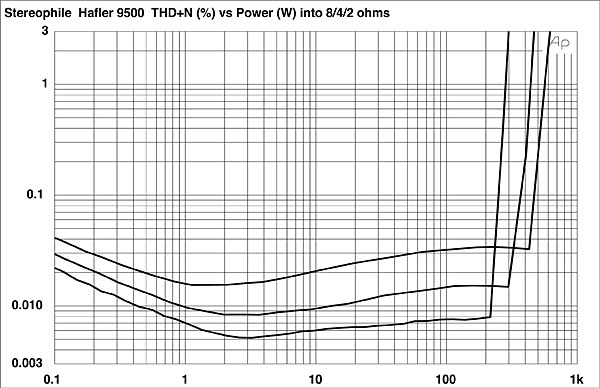
The THD+noise vs level curves for the 9500, one channel driven, are shown in fig.8. The output continues to increase with dropping load impedance; though consistent with its specifications, the output does not double with each halving of the load value. It will put out its rated power without complaining, though the distortion at the 250W (8 ohm) and 375W (4 ohm) points are nearer 0.1% than the rated 0.03% (a difference that could be at least partially accounted for by a line voltage slightly below 120V). The actual clipping powers were 273Wpc into 8 ohms (24.4dBW, AC line voltage 116V) and 434W into 4 ohms (23.4dBW, 114V) with both channels driven, and 591W into 2 ohms (21.7dBW, 113V) with one channel driven.
Fig.8 Hafler Transnova 9500, THD+N (%) vs output power into 8, 4, and 2 ohms.
It is not at all uncommon for amplifiers putting out this kind of power, particularly moderately priced ones, to blow fuses while attempting to take these measurements, especially at low impedances. I did not lose a single fuse with the Hafler. I should note that these continuous powers were only held for a couple of seconds—long enough for the Audio Precision test set to stabilize and to read the measurement. But it's unlikely that any real-world application would require these power outputs for longer than that—most loudspeakers would melt under such continuous drive.


