Sidebar 3: Measurements
I measured the KEF R700's frequency response in the farfield with DRA Labs' MLSSA system and a calibrated DPA 4006 microphone. I used an Earthworks QTC-40 for the nearfield response. All measurements were performed with the grille removed and with the twin ports' supplied foam plugs removed.
My estimate of the KEF R700's B-weighted voltage sensitivity was 87dB(B)/2.83V/m, which is 2dB lower than the specified 89dB/2.83V/m. KEF specifies the R700's impedance as 8 ohms with a minimum magnitude of 3.2 ohms. My own measurement (fig.1) shows that the minimum impedance, which includes the impedance of 10' of speaker cable, was 3.3 ohms at 145Hz. The impedance magnitude (solid trace) remains between 4 and 6 ohms for almost all of the audioband, but the electrical phase angle (dashed trace) is generally benign.


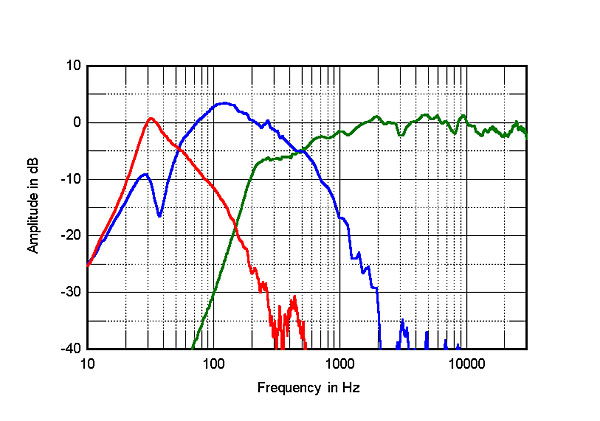 Fig.4 shows how these individual responses sum in the farfield. Below 300Hz, the trace shows the complex sum of the nearfield midrange, woofer, and port outputs, taking into account acoustic phase and the different distance of each radiator from a nominal farfield microphone position. The broad peak in the upper bass will be an artifact of the nearfield measurement technique, which assumes a 2pi, hemispherical acoustic environment rather than the actual 4pi, spherical one. The gentle rise in the lower midrange does appear to be real, however. Above 300Hz in this graph, the trace shows the KEF speaker's response averaged across a 30° horizontal window centered on the tweeter axis. Other than the slightly plateaued-down output above 10kHz, the R700's response is impressively flat.
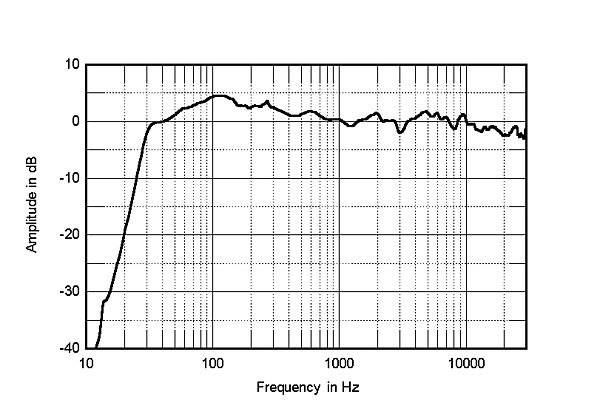


Fig.1 KEF R700, electrical impedance (solid) and phase (dashed) (2 ohms/vertical div.).
The impedance traces reveal none of the small wrinkles that would point to the presence of panel resonances, and the R700's large enclosure was quite dead to the knuckle-rap test. Investigating the panel's vibrational behavior with an accelerometer did uncover a mode at 488Hz on the sidewalls level with the lower woofer (fig.2); also present was a mode slightly lower in frequency, at 449Hz, on the top panel and the sidewalls level with the coincident Uni-Q unit. However, all of these resonant modes are relatively low in level; this, coupled with their high frequency and Quality factor (Q), will minimize any audible effects.
Fig.2 KEF R700, cumulative spectral-decay plot calculated from output of accelerometer fastened to center of side panel level with lower woofer (MLS driving voltage to speaker, 7.55V; measurement bandwidth, 2kHz).
The blue trace in fig.3 is the summed output of the R700's woofers and the red trace is the summed output of the two ports, both measured in the nearfield. While the ports offer identical outputs, in the woofers' outputs the minimum-motion notch, which is where the back pressure from the port resonance holds the woofer cone stationary, occurs at a slightly different frequency for each. The upper-frequency rolloffs of the ports and woofers are smooth and free from resonant peaks. The green trace below 500Hz in fig.3 is the response of the Uni-Q unit, again measured in the nearfield and plotted at a level proportional to the ratio of the square root of its radiating area to the square root of the woofers' radiating areas. The crossover from the woofers appears to be close to the specified 500Hz, and the Uni-Q unit doesn't begin its ultimate high-pass rollout until just above 200Hz. Above 500Hz, the Uni-Q's farfield output rises slowly to 1500Hz, but is then remarkably even until the top octave, where it plateaus down by a dB or so.
Fig.3 KEF R700, acoustic crossover on tweeter axis at 50", corrected for microphone response, with nearfield responses of midrange unit (green trace), woofer (blue), and port (red), respectively plotted below 500Hz, 500Hz, and 550Hz
Fig.4 KEF R700, anechoic response on tweeter axis at 50", averaged across 30° horizontal window and corrected for microphone response, with complex sum of nearfield responses plotted below 300Hz.
Thomas J. Norton had a reservation about the KEF's "subtle reticence at the very top end." The shelving-down of the response in the top octave is not severe enough to warrant such a reservation, though I suspect that it probably contributes to my lower-than-specified sensitivity figure. However, when you look at the R700's plot of lateral dispersion (fig.5), you can see that the speaker's output above the cursor position at 3.1kHz increasingly but smoothly slopes down as the microphone is moved to the speaker's sides. This is presumably due to the manner in which the Uni-Q tweeter's dispersion is modified by its being mounted in the center of the midrange cone. In a room with typical furnishings, it will result in exactly the character TJN noted in the review. But it is important to note the evenness of the contour lines in this plot, with no hot spots or gullies, which correlates with the excellently precise and stable stereo imaging he noted. The Uni-Q's top-octave dispersion is maintained to 20° off axis, which in the vertical plane (fig.6) means that the R700's tonal balance is not significantly affected by the height of the listener's ears. This is just as well, considering that the R700's tweeter is just 30" above the floor; a study conducted for Stereophile by TJN two decades ago showed that the average height above the floor of the ears of a listener seated in a normal chair is 36".
Fig.5 KEF R700, lateral response family at 50", normalized to response on tweeter axis, from back to front: differences in response 90–5° off axis, reference response, differences in response 5–90° off axis.
Fig.6 KEF R700, vertical response family at 50", normalized to response on tweeter axis, from back to front: differences in response 15–5° above axis, reference response, differences in response 5–10° below axis.
In the time domain, the R700's step response on the tweeter axis (fig.7) reveals that the tweeter and woofers are connected in positive acoustic polarity, the midrange in inverted polarity. Some Internet know-alls have opined that this mixture of polarities is a problem. It isn't. What actually matters is that the decay of each drive-unit's step smoothly blends with the start of the step of the unit next lower in frequency. In this case, this results in the superb frequency-domain integration of the R700's outputs seen in fig.4. The cumulative spectral-decay plot on the tweeter axis (fig.8) also justifies the adjective superb, as in superbly clean.
Fig.7 KEF R700, step response on tweeter axis at 50" (5ms time window, 30kHz bandwidth).
Fig.8 KEF R700, cumulative spectral-decay plot on tweeter axis at 50" (0.15ms risetime).
This relatively inexpensive full-range tower speaker demonstrates some excellent engineering expertise on the part of KEF's Jack Oclee-Brown and his team.—John Atkinson


