Sidebar 2: Measurements
As can be seen from fig.1, the Levinson No.29 exhibits a very slight rolloff at the frequency extremes, to a degree which should be audibly insignificant. The 10kHz squarewave (fig.2) indicates a small rise-time, with very slight rounding of the leading edge reflecting the gentle HF rolloff above 20kHz. Polarity of the Levinson was non-inverting, the 1kHz input impedance of 57k ohms was just slightly above spec, and 140.2mV were required to give 1W into 8 ohms—a gain of 26.1dB. Unweighted noise was 89dB below 1W into 8 ohms. Channel separation was better than 108dB below 1kHz (nearly 115dB below 200Hz), decreasing smoothly to 85dB at 20kHz.


 None of the measurements indicate that the Levinson should sound anything but first-rate. This doesn't always prove to be true, but in this case it definitely did.—Thomas J. Norton
Fig.1 Mark Levinson No.29, frequency response at 1W into 8 ohms (right channel dashed, 0.5dB/vertical div.).
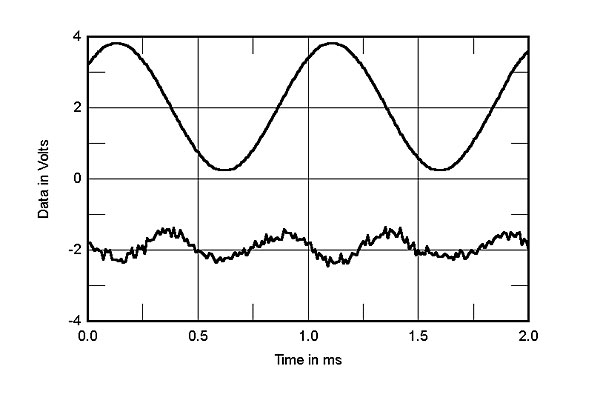
Fig.2 Mark Levinson No.29, small-signal 10kHz squarewave into 8 ohms.
The output impedance of the No.29 was uniformly low, ranging from 0.043 to 0.073 ohms across the audible range. Distortion at low power was uniformly low, as is clear from fig.3, which plots THD+noise against frequency at 2.83V into 8, 4, and 2 ohms (bottom, middle, and top traces, respectively). As expected, the distortion increases into the lower-impedance load and rises somewhat at high frequencies, but remains negligibly low in all cases. The waveform of the distortion in fig.4 (1kHz at 1W into 8 ohms) shows a predominantly second-harmonic characteristic overlaid with very low-level noise. A similar curve for a 1kHz signal into a 4 ohm load, 2W out (not shown), was similar but with less noise.
Fig.3 Mark Levinson No.29, THD+noise vs frequency at (from top to bottom at 10kHz): 4W into 2 ohms, 2W into 4 ohms, 1W into 8 ohms.
Fig.4 Mark Levinson No.29, 1kHz waveform at 2W into 4 ohms (top); distortion and noise waveform with fundamental notched out (bottom, not to scale).
Fig.5 shows the spectrum of a 50Hz sinewave driven at 67W into 4 ohms. The second harmonic is down 79dB; a couple of higher harmonics are still visible but down even further in level. Fig.6 shows the high-frequency IM spectrum with an equal mixture of 19 and 20kHz tones driven at 67W into 4 ohms. The 1kHz product lies at –76dB, a negligible 0.0015%, which is pretty much the residual in the output of the CD player used to drive the amp for this measurement. A similar measurement for 33W into 8 ohms was virtually identical—actually slightly better at –79dB (0.001%).
Fig.5 Mark Levinson No.29, spectrum of 50Hz sinewave, DC-1kHz, at 67W into 4 ohms (linear frequency scale).
Fig.6 Mark Levinson No.29, HF intermodulation spectrum, DC-22kHz, 19+20kHz at 67W into 4 ohms peak into 8 ohms (linear frequency scale).
Fig.7 indicates the THD vs power for 8, 4, and 2 ohms at 1kHz, one channel driven (bottom, middle, and top curves at 10W, respectively; line voltage of 117V). The maximum output power at 1% THD was 66W (18.2dBW) into 8 ohms, 120W (17.8dBW) into 4 ohms, and 180W (16.5dBW) into 2 ohms. These figures all lie well above the "knee" of the distortion curve. In my opinion, the highest useful power output of an amplifier with a sharply defined distortion "knee" is at the knee itself; although an amplifier will still put out power above this point, in reality the distortion is rising rapidly. In the case of the No.29, that knee is at 59W into 8 ohms, 95W into 4 ohms, and 160W into 2 ohms. At these outputs the distortion is still very low; the Levinson's power output is specified at a slightly higher 0.3%, and it meets or betters the specification. Again, however, that distortion figure falls above the knee of each curve.
Fig.7 Mark Levinson No.29, distortion (%) vs output power into (from bottom to top at 40W): 8 ohms, 4 ohms, and 2 ohms.
With both channels driven, the No.29's output power was 65.3W (18.1dBW) into 8 ohms, 111.8W (17.5dBW) into 4 ohms (both for the right channel—the left was marginally higher). Because the No.29 is a totally dual-mono design, the power output should be identical to either one or both channels driven. The discrepancy here probably results from a slight droop in the AC supply with both channels driven rather than one. In any case, these figures can only be approximate because the output power is read directly off the computer display "meter" on the Audio Precision test set. Because the arbitrary 1% THD mark lies on the steep distortion slope above the knee of the curve in fig.7 as the output level is increased, zeroing-in precisely on the 1% distortion figure is prone to a 5–10% error.
Finally, DC offset in the No.29 was 7mV in the left channel, 8mV in the right. The Levinson also operated moderately warm to the touch after its 1-hour, 1/3-power preconditioning into 8 ohms.


