Sidebar 3: Measurements
I used DRA Labs' MLSSA system and a calibrated DPA 4006 microphone to measure the Polk Legend L100's frequency response in the farfield, and an Earthworks QTC-40 mike for the nearfield responses.
Polk specifies the L100's sensitivity as 85.5dB/2.83V/m; my estimate was actually a little higher, at 87dB(B)/2.83V/m. The L100's impedance is specified in the manual as 4 ohms, with a minimum magnitude of 3 ohms, though on Polk's website it is specified as 3–4 ohms. The solid trace in fig.1 shows that the impedance magnitude remains above 4 ohms from the bass through to the low treble but does drop to just below 3 ohms between 4kHz and 7kHz. The electrical phase angle (dashed trace) is occasionally high, and I used the formula in a 1994 JAES paper by Eric Benjamin to calculate the "equivalent peak dissipation resistance" (EPDR, footnote 1). The L100 has minimum EPDRs of 1.73 ohms between 127Hz and 140Hz and 1.25 ohms between 3.3kHz and 3.6kHz. This loudspeaker will work best with amplifiers that are comfortable driving loads below 4 ohms. This is probably why KM found that the Polk speakers proved a better match with some amplifiers than others.

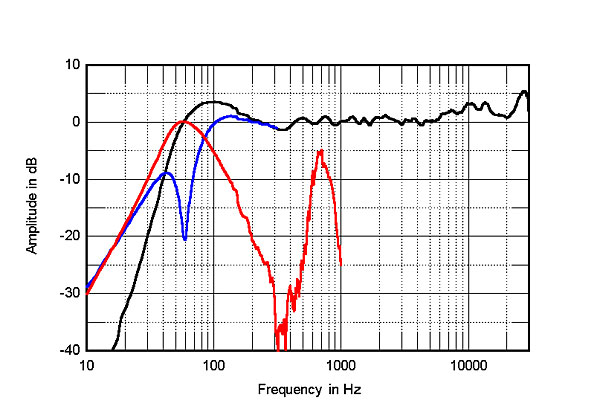 The Polk's farfield response, taken without the grille and averaged across a 30° horizontal window centered on the tweeter axis, is shown as the black trace above 300Hz in fig.3. The balance is superbly flat from the midrange through the mid-treble but with a slight rising trend visible above 6kHz. This behavior might correlate with KM finding the upper-midrange and treble to be somewhat forward-sounding, Repeating the measurement with the grille reduced the on-axis output in the top two audio octaves by 1–2dB.
Fig.4 shows the Polk's horizontal radiation pattern. (The off-axis responses are normalized to the response without the grille on the tweeter axis, which thus appears as a straight line.) The contour lines in this graph are evenly spaced between 1kHz and 5kHz, which suggests stable stereo imaging. I suspect that the apparent peak around 700Hz far to the speaker's sides is due to the microphone picking up more of the port's output. As I have found with other ring-radiator tweeters, the L100's dispersion dramatically narrows in the top octaves, which will work against the audibility of the excess of on-axis energy in the same region. This behavior also suggests that the Polk's treble balance can be fine-tuned by experimenting with toe-in.
The Polk's farfield response, taken without the grille and averaged across a 30° horizontal window centered on the tweeter axis, is shown as the black trace above 300Hz in fig.3. The balance is superbly flat from the midrange through the mid-treble but with a slight rising trend visible above 6kHz. This behavior might correlate with KM finding the upper-midrange and treble to be somewhat forward-sounding, Repeating the measurement with the grille reduced the on-axis output in the top two audio octaves by 1–2dB.
Fig.4 shows the Polk's horizontal radiation pattern. (The off-axis responses are normalized to the response without the grille on the tweeter axis, which thus appears as a straight line.) The contour lines in this graph are evenly spaced between 1kHz and 5kHz, which suggests stable stereo imaging. I suspect that the apparent peak around 700Hz far to the speaker's sides is due to the microphone picking up more of the port's output. As I have found with other ring-radiator tweeters, the L100's dispersion dramatically narrows in the top octaves, which will work against the audibility of the excess of on-axis energy in the same region. This behavior also suggests that the Polk's treble balance can be fine-tuned by experimenting with toe-in.
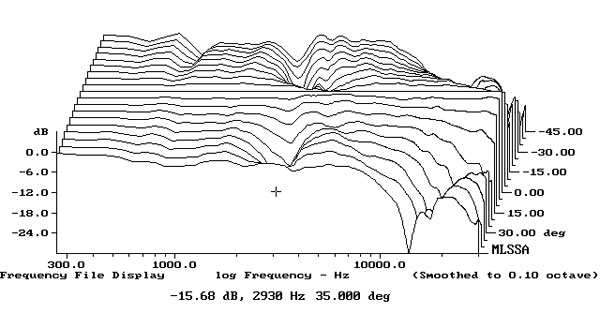
 In the vertical plane (fig.5), again with the off-axis response normalized to the tweeter-axis response, a suckout centered on the specified crossover frequency of 2.9kHz develops immediately above the tweeter axis. This suckout doesn't appear until 15° below the tweeter axis, which means that the L100s should be used with stands that are sufficiently high so that the listener can't see the tops of the cabinets.

Footnote 1: EPDR is the resistive load that gives rise to the same peak dissipation in an amplifier's output devices as the loudspeaker. See "Audio Power Amplifiers for Loudspeaker Loads," JAES, Vol.42 No.9, September 1994, and stereophile.com/reference/707heavy/index.html.
Fig.1 Polk Legend L100, electrical impedance (solid) and phase (dashed) (2 ohms/vertical div.).
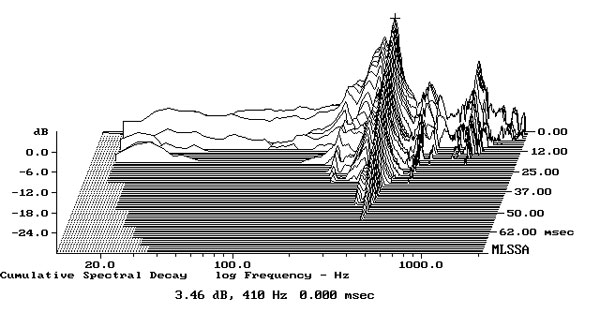
There are small discontinuities in the traces in fig.1 that imply resonances of some kind. When I investigated the enclosure's vibrational behavior with a plastic-tape accelerometer, I found strong resonant modes at 410Hz on the side panels (fig.2) and at 363Hz on the top panel. A strong mode was also present at 685Hz on the "Enhanced Power Port" diffuser. All the modes were of relatively high Q (Quality Factor) and so might not be as audible as their amplitudes would imply.
Fig.2 Polk Legend L100, cumulative spectral-decay plot calculated from output of accelerometer fastened to center of side panel (MLS driving voltage to speaker, 7.55V; measurement bandwidth, 2kHz).
The saddle centered at 58Hz in the impedance magnitude trace suggests that this is the tuning frequency of the port on the rear panel. The minimum-motion notch in the woofer's output (fig.3, blue trace) lies at that frequency, and the port's output (fig.3, red trace) peaks in textbook fashion between 40Hz and 100Hz. There is the usual boost in the upper bass in both the woofer and port outputs, which will be due to the nearfield measurement technique; the actual bass alignment is maximally flat. The port's upper-frequency rolloff is relatively clean but is disturbed by a fairly broad peak centered just below 700Hz. This frequency is suspiciously close to that of sharp discontinuities in both the impedance magnitude and phase-angle traces. This midrange peak in the port's output is probably due to an internal air-space resonance rather than to the enclosure's vibrational behavior. However, I note that KM wasn't bothered by any coloration that would have resulted from the midrange peak in the port's output. Perhaps this is due to the fact that the port both faces away from the listener and is obscured by the cone-shaped diffusor.
Fig.3 Polk Legend L100, anechoic response on tweeter axis without grille at 50", averaged across 30° horizontal window and corrected for microphone response, with the nearfield responses of the woofer (blue) and port (red), respectively plotted below 300Hz and 1kHz.
Fig.4 Polk Legend L100, lateral response family at 50", normalized to response on tweeter axis, from back to front: differences in response 90–5° off axis, reference response, differences in response 5–90° off axis.
Fig.5 Polk Legend L100, vertical response family at 50", normalized to response on tweeter axis, from back to front: differences in response 45–5° above axis, reference response, differences in response 5–45° below axis.
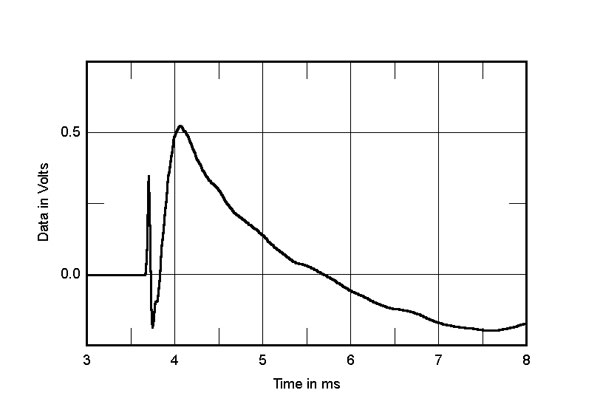
In the time domain, the L100's step response on the tweeter axis (fig.6) indicates that both drive-units are connected in positive polarity. The tweeter's step arrives first at the microphone, and the decay of its step doesn't quite smoothly blend with the positive-going start of the woofer's step. This means that the optimal integration of their outputs occurs just below the tweeter axis. Again, a high stand needs to be used with this speaker. Other than small amounts of delayed energy in the midrange, the Polk Legend L100's cumulative spectral-decay plot (fig.7) is superbly clean overall. (As always with my CSD plots, ignore the small ridge just below 17kHz, which is due to interference from the computer monitor's line-scan frequency. Note also that this graph has not been compensated for the measuring microphone's departure from a flat response.)
Fig.6 Polk Legend L100, step response on tweeter axis at 50" (5ms time window, 30kHz bandwidth).
Fig.7 Polk Legend L100, cumulative spectral-decay plot on tweeter axis at 50" (0.15ms risetime).
Overall, the Polk Legend L100 offers excellent measured performance, indicating equally excellent audio engineering.—John Atkinson
Footnote 1: EPDR is the resistive load that gives rise to the same peak dissipation in an amplifier's output devices as the loudspeaker. See "Audio Power Amplifiers for Loudspeaker Loads," JAES, Vol.42 No.9, September 1994, and stereophile.com/reference/707heavy/index.html.


