Sidebar 3: Measurements
I measured the Roksan Kandy K2 BT using my Audio Precision SYS2722 system (see www.ap.com, and the January 2008 "As We See It"). Before performing any measurements on an amplifier, I run it for an hour with both channels operating at one-third its specified maximum power into 8 ohms. Like the earlier Kandy K2, reviewed by Art Dudley in May 2010, the K2 BT got very hot after 30 minutes, at which point I cut short the conditioning.
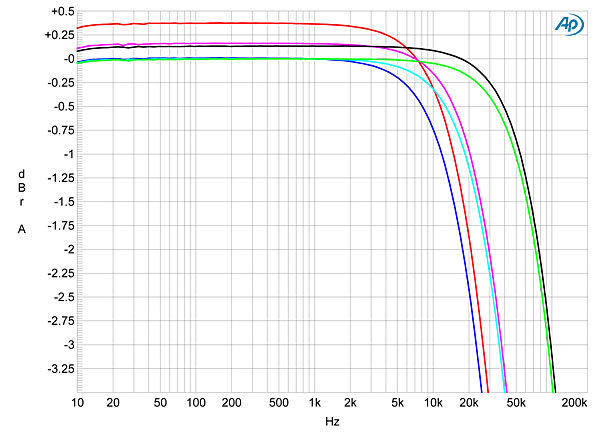
The first test I usually perform with an amplifier after this preconditioning period is to examine its behavior with squarewaves. The original K2's reproduction of a 10kHz squarewave was excellent, with a very short risetime (see fig.4 here). By contrast, the K2 BT's reproduction of a 10kHz squarewave (fig.1) had long risetimes, equating to a limited ultrasonic response. It turned out that the Roksan's frequency response depends to a larger extent than usual on its volume-control setting. Fig.2 shows the amplifier's response with the volume control set to 9 o'clock (left channel green, right gray), 12 o'clock (left blue, right red), and 3 o'clock (left cyan, right magenta). At the lowest setting of the control, the output is down by 3dB at 95kHz, but with it set to 12 o'clock, which is where I'd measured the squarewave response, the –3dB point has moved down to 24kHz. Increasing the volume past that point increased the ultrasonic bandwidth, and at 3 o'clock the –3dB point was 35kHz, while with the control set to its maximum (fig.3, blue and red traces), the –3dB output lay at 115kHz. Note, too, that the channel matching also changes with the setting of the volume control, the maximum difference between the channel gains (0.35dB in favor of the right channel) occurring with the volume control set to 12 o'clock.


 As I wrote in the Arcam review, the aptX codec throws away absolute resolution in favor of preserving a random noise floor because this will be less annoying with music. But the true test of a lossy codec is to listen to it, which is what HR did, of course.—John Atkinson
Fig.1 Roksan Kandy K2 BT, small-signal 10kHz squarewave into 8 ohms.
Fig.2 Roksan Kandy K2 BT, frequency response at 2.83V into 8 ohms with volume control set to: 9 o'clock (left channel green, right gray), 12 o'clock (left blue, right red), 3 o'clock (left cyan, right magenta) (0.5dB/vertical div.).
Fig.3 Roksan Kandy K2 BT, volume control set to maximum, frequency response at 2.83V into: simulated loudspeaker load (gray), 8 ohms (left channel blue, right red), 4 ohms (left cyan, right magenta), 2 ohms (green) (2dB/vertical div.).
In most respects, the K2 BT measured very similarly to the K2, with an input impedance of around 23k ohms, an output impedance of 0.1 ohm at low and middle frequencies, and a maximum voltage gain into 8 ohms of 37.3dB, 5.8dB of which came from the preamplifier section. The K2 BT also preserved absolute polarity for all its inputs, including phono. Though the maximum power listed in the BT's specifications was greater, at 140Wpc vs 125Wpc, the measured power at clipping into 8 ohms (defined as when the THD+noise percentage reaches 1%) was 140Wpc (21.5dBW, fig.4), compared with 137Wpc for the original K2. The clipping power into 4 ohms was also very similar, at just under 200Wpc (20dBW, fig.5), as was the distortion signature, which was predominantly second harmonic (fig.6). The phono input's RIAA error (fig.7), assessed at the preamplifier output jacks, was identical to that of the earlier version, with minimal error in the audioband but a slight rise at ultrasonic frequencies.
Fig.4 Roksan Kandy K2 BT, distortion (%) vs 1kHz continuous output power into 8 ohms.
Fig.5 Roksan Kandy K2 BT, distortion (%) vs 1kHz continuous output power into 4 ohms.
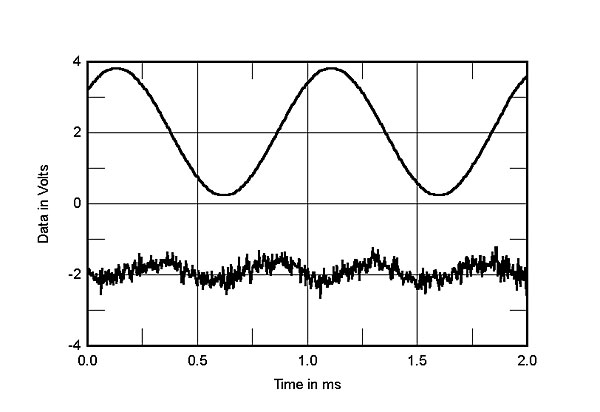
Fig.6 Roksan Kandy K2 BT, 1kHz waveform at 20W into 4 ohms, 0.046% THD+N (top); distortion and noise waveform with fundamental notched out (bottom, not to scale).
Fig.7 Roksan Kandy K2 BT, phono input, response with RIAA correction (left channel blue, right red) (0.5dB/vertical div.).
But it's the Bluetooth input that distinguishes this version of the Kandy from the one that AD reviewed, and I examined the performance of the K2 BT's Bluetooth input using both an iPad 2, which uses the default AAC codec, and my 2012 MacBook Pro, which has the better-performing aptX codec (all MacBooks with OS 10.6.5 or later have aptX). Because the Bluetooth connection uses a lossy codec, measuring its performance is no straightforward task. (I offered a primer on assessing Bluetooth behavior in my review of the Arcam rBlink Bluetooth D/A processor in March 2014.)
Playing files with iTunes with its volume control set to the maximum, the Roksan's analog output waveform, assessed at the preamplifier output jacks, was severely clipped. I had to back off the MacBook's volume control to approximately 90% before the K2 BT's output waveform was free from clipping; at that point, the level was 2.3V. So if you use the Roksan's BT input, keep your source's volume control down. However, when I sent the K2 BT dithered 16-bit data representing a 1kHz tone at –90dBFS, there was no 1kHz content in the spectrum of the amplifier's output. This was presumably because I'd set the laptop's volume control to 90%, to avoid clipping, which had dropped the tone below the 16-bit quantization floor. Resetting my laptop's volume control to its maximum and repeating the analysis gave a spectrum with a 1kHz tone at –90dBFS (fig.8). However, the noise floor is hashy-looking.
Fig.8 Roksan Kandy K2 BT, spectrum with noise and spuriae of dithered 1kHz tone at –90dBFS with 16-bit data sourced from MacBook Pro running aptX (left channel blue, right red) (20dB/vertical div.).
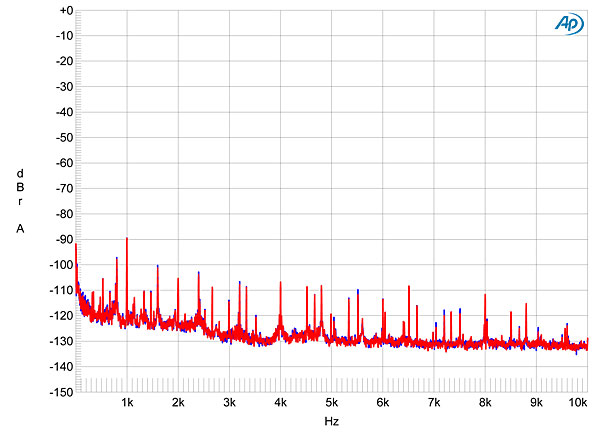
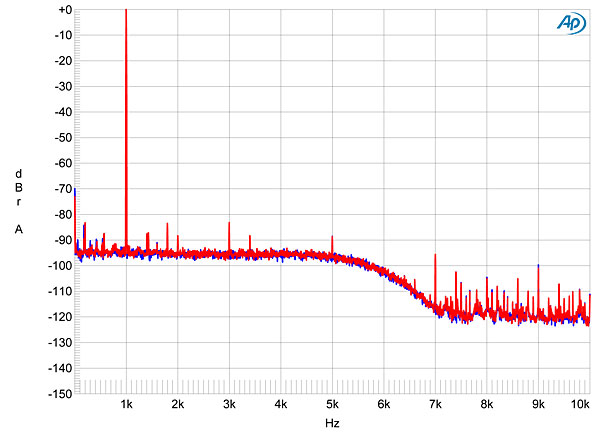
The Bluetooth connection is limited to sample rates of 44.1 and 48kHz and a bit depth of 16. The BT input's impulse response was that of a conventional, time-symmetrical, linear-phase reconstruction filter (not shown), while the frequency response with 44.1kHz data featured a gentle rolloff in the top audio octave that reached –1dB at 20kHz (fig.9). With a full-scale 1kHz tone (fig.10), the aptX codec's limited bit budget results in the noise floor rising below 7kHz, while with the gapped, multitone test signal that I discussed in the Arcam review (fig.11), the codec preserves as much resolution in the midrange and low treble, where human hearing is sensitive, compared with the top two octaves, where hearing sensitivity decreases. Tested with the 16-bit J-Test signal, which comprises a high-level tone at one-quarter the sample rate and an LSB-level, low-frequency squarewave, the rise in the noise floor in the top octaves masks both any jitter artifacts and the odd-order harmonics of the squarewave (fig.12).
Fig.9 Roksan Kandy K2 BT, Bluetooth frequency response at 44.1kHz (left channel blue, right red) (0.5dB/vertical div.).
Fig.10 Roksan Kandy K2 BT, spectrum of 1kHz sinewave, DC–10kHz, at 0dBFS into 100k ohms, data sourced from MacBook Pro running aptX (left channel blue, right red) (linear frequency scale).
Fig.11 Roksan Kandy K2 BT, spectrum of 16-bit multitone signal, data sourced from MacBook Pro running aptX (left channel blue, right red) (linear frequency scale, 20dB/vertical div.).
Fig.12 Roksan Kandy K2 BT, high-resolution jitter spectrum of analog output signal, 11.025kHz at –6dBFS, sampled at 44.1kHz with LSB toggled at 229Hz: 16-bit data sourced from MacBook Pro running aptX (left channel blue, right red). (Center frequency of trace, 11.025kHz; frequency range, ±3.5kHz.)


