Sidebar 3: Measurements
I performed a full set of measurements on Schiit Audio's Ragnarok using my Audio Precision SYS2722 system (see the January 2008 "As We See It"). Looking first at the small-signal measurements taken from the loudspeaker outputs (see later), the amplifier's maximum voltage gain into 8 ohms was 26.17dB with the gain set to "26," 15.1dB with it set to "14," and 3.7dB with it set to "0." These gains were identical for both balanced and single-ended input signals, and the amplifier preserved absolute polarity (ie, was non-inverting) for all inputs and outputs. The unbalanced input impedance was close to 10k ohms at all audio frequencies, twice that value for the balanced inputs.
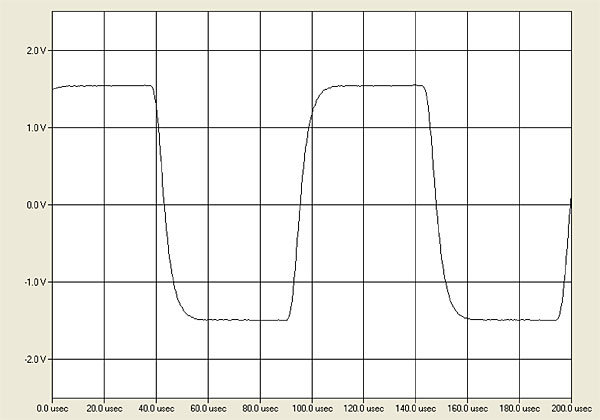
The gain, measured at the unbalanced headphone jack on the front panel, was 21.4, 10.7, and –0.5dB for the three gain settings; the output impedance from this jack varied from 10.7 ohms at 20Hz to 8.5 ohms at 20kHz. The output impedance from the speaker terminals is specified as a very low 0.03 ohm. However, my estimate, taken at an output level of 400mV, was much higher: 1 ohm at 20Hz, and 1.2 ohms at 1 and 20kHz. As a result, the amplifier's response driving our standard simulated loudspeaker varied by up to ±0.8dB (fig.1, gray trace). This graph also shows that the responses into resistive loads were flat up to 10kHz, with a gentle rolloff at ultrasonic frequencies. As a result, the Ragnarok's reproduction of a 10kHz squarewave into 8 ohms (fig.2) was very good, with no overshoot or ringing visible. Commendably, the amplifier's frequency response was not affected by the volume-control setting and was identical when measured from the headphone jacks.

 The increasing distortion was due to the amplifier's output stage becoming starved for bias current, meaning that it moved steadily into class-B operation, with dead periods appearing at the zero-crossing points (fig.4). If I turned the amplifier off and waited a few minutes before turning it back on, it began with respectably low distortion, as before, but again quickly moved into starved-bias class-B as it warmed up. The degree of the reduction in output-stage bias depended on the signal level; fig.5 plots the THD+N percentage against time at three power levels: 10V (cyan and magenta traces), 3V (blue, red), and 300mV (green, gray). You can see that only at the lowest level is there no change in the THD+N. Concerned that our sample had broken in transit to my test lab, I contacted Schiit Audio's Jason Stoddard.

 "As far as I know, #1 above is unique . . . the algorithm actually biases the output stage in real time—measuring about 30 times per second, and adjusting 3 times per second, with variable adjustment rates based on the slope of the readings. We did this to eliminate the DC servo, and its signal bleed back to the input stage. The bottom line of this craziness is that the algorithm is very good at distinguishing music signals from overcurrent conditions (and not de-biasing the output stage—confirmed by many hundreds of hours of observation). However, it is not good at distinguishing continuous tones from runaway bias—therefore, it continuously adjusts the bias down in the presence of a standard preconditioning test."
I admit, I was suspicious of Stoddard's explanation: I was taught that designers must actively avoid modulating an amplifier's operating parameters with the signal being amplified. Unless they use a very long time constant—as with a DC servo, or the sliding bias featured by mid-1990s amplifiers from Krell and Mark Levinson—the parameters will be correlated with the envelope of the music signal, which can result in distortion and noise modulation. And if the time constant is short enough to react within a few seconds (as in fig.5), I wondered if there would be a history effect; ie, if the amplifier's operating condition would reflect the properties of the music signal integrated over the time constant. I waited until the continuous 1kHz signal used to generate fig.4 had fully starved the output stage of bias current, then replaced it with a 1kHz toneburst signal that alternated between 1000 cycles at 100mV and 9000 cycles at 10mV. As I watched the waveform on the oscilloscope, it took six minutes for the bias to return to its appropriate level for the 10mV signal, with appropriately low distortion.
According to Jason Stoddard, "It takes more than several seconds to de-bias the output—it doesn't adjust that fast. We've tested it extensively with actual music, monitoring the output of the bias control circuit in real time, with no observed significant de-biasing behavior."
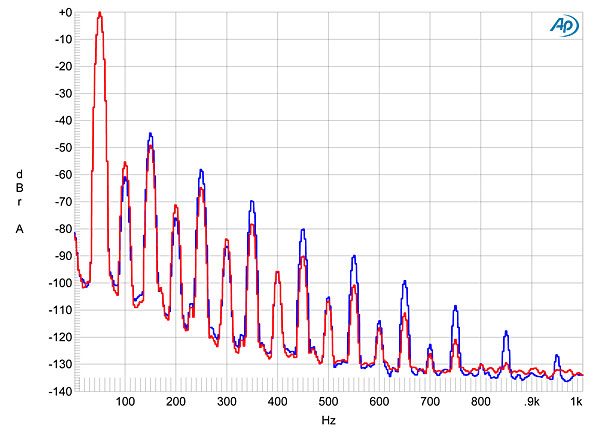
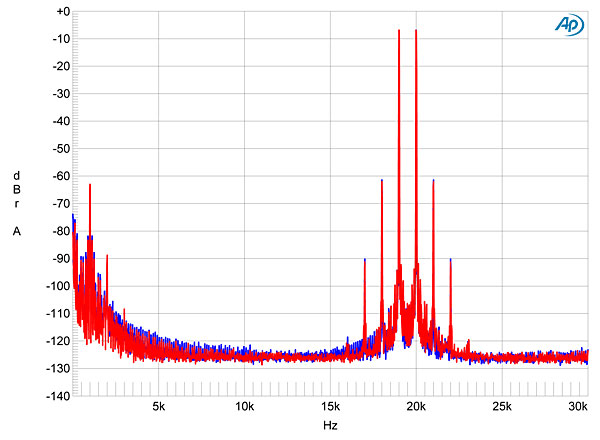
This behavior was going to make testing the Ragnarok's production of distortion, which is usually performed with continuous tones, problematic. For example, I tried looking at the Ragnarok's production of harmonic and intermodulation distortion at different continuous levels. Fig.6 shows a spectral analysis of the amplifier's output with a 50Hz tone at 1V output into 8 ohms; fig.7 shows the analysis at 10V. The dominant harmonic at 1V is the subjectively innocuous second harmonic at a low level, 0.05%; but at the higher level, the third harmonic has risen to 0.5%. Similarly, fig.8 shows the spectrum of the Raganarok's output as it amplified an equal mix of 19 and 20kHz tones with a peak amplitude of 3V into 8 ohms. The 1kHz difference product lies at –63dB (0.07%), which is respectably low—but when I increased the level to 10V peak, a slew of higher-order intermodulation products appeared. Given the action of the microprocessor in adjusting the output-stage bias current, I'm sure that these graphs don't reflect the amplifier's behavior with music signals, which have a much higher crest factor than test tones.
"As far as I know, #1 above is unique . . . the algorithm actually biases the output stage in real time—measuring about 30 times per second, and adjusting 3 times per second, with variable adjustment rates based on the slope of the readings. We did this to eliminate the DC servo, and its signal bleed back to the input stage. The bottom line of this craziness is that the algorithm is very good at distinguishing music signals from overcurrent conditions (and not de-biasing the output stage—confirmed by many hundreds of hours of observation). However, it is not good at distinguishing continuous tones from runaway bias—therefore, it continuously adjusts the bias down in the presence of a standard preconditioning test."
I admit, I was suspicious of Stoddard's explanation: I was taught that designers must actively avoid modulating an amplifier's operating parameters with the signal being amplified. Unless they use a very long time constant—as with a DC servo, or the sliding bias featured by mid-1990s amplifiers from Krell and Mark Levinson—the parameters will be correlated with the envelope of the music signal, which can result in distortion and noise modulation. And if the time constant is short enough to react within a few seconds (as in fig.5), I wondered if there would be a history effect; ie, if the amplifier's operating condition would reflect the properties of the music signal integrated over the time constant. I waited until the continuous 1kHz signal used to generate fig.4 had fully starved the output stage of bias current, then replaced it with a 1kHz toneburst signal that alternated between 1000 cycles at 100mV and 9000 cycles at 10mV. As I watched the waveform on the oscilloscope, it took six minutes for the bias to return to its appropriate level for the 10mV signal, with appropriately low distortion.
According to Jason Stoddard, "It takes more than several seconds to de-bias the output—it doesn't adjust that fast. We've tested it extensively with actual music, monitoring the output of the bias control circuit in real time, with no observed significant de-biasing behavior."
This behavior was going to make testing the Ragnarok's production of distortion, which is usually performed with continuous tones, problematic. For example, I tried looking at the Ragnarok's production of harmonic and intermodulation distortion at different continuous levels. Fig.6 shows a spectral analysis of the amplifier's output with a 50Hz tone at 1V output into 8 ohms; fig.7 shows the analysis at 10V. The dominant harmonic at 1V is the subjectively innocuous second harmonic at a low level, 0.05%; but at the higher level, the third harmonic has risen to 0.5%. Similarly, fig.8 shows the spectrum of the Raganarok's output as it amplified an equal mix of 19 and 20kHz tones with a peak amplitude of 3V into 8 ohms. The 1kHz difference product lies at –63dB (0.07%), which is respectably low—but when I increased the level to 10V peak, a slew of higher-order intermodulation products appeared. Given the action of the microprocessor in adjusting the output-stage bias current, I'm sure that these graphs don't reflect the amplifier's behavior with music signals, which have a much higher crest factor than test tones.


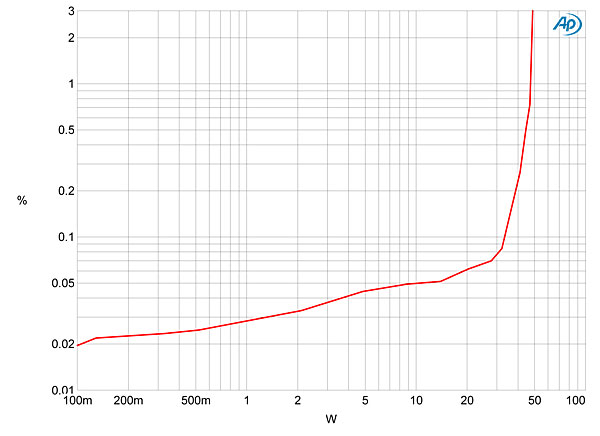
 The result of this test is shown in fig.11, which plots the level of the third harmonic against power into 8 ohms. At low levels, the third harmonic lay at or below 0.03% (–70dB), which is respectable behavior. (At 300mW, the second harmonic lay at 0.007%, –83dB, and the fifth harmonic at 0.003%, –90dB, both almost buried in the noise floor.) As the output power increased, the third harmonic slowly rose in a linear manner, but remained low until just above 30W, when it began to rise. (The levels of the second and fifth harmonics didn't change significantly between 300mW and 30W, other than being increasingly separated from the background noise.) The third and fifth harmonics each reached 1% at 48Wpc (16.8dBW) in fig.9, due to the clipping of the tops and bottoms of the waveform. So with this toneburst signal, the Ragnarok doesn't reach its specified maximum power of 60Wpc into 8 ohms (17.8dBW). Whether the shortfall of 1dB is or is not significant will depend very much on the music being played—as will, of course, the behavior of the amplifier's output stage.
 Well there it is.— John Atkinson
Postscript: After the review had been laid out for print, I thought of a way of unmasking the action of the microprocessor that adjusts the output-stage bias current: Play music with high-level sustained tones for five minutes or so, then immediately examine the distortion with a sinewave tone before the microprocessor can react.
I played my recording of Jonas Nordwall playing the Toccata of Widor's Organ Symphony 5 (which has sustained organ-pedal notes) at a level that reached 20Wpc at the climax but for much of the time averaged less than 1Wpc. As soon as the musical climax finished, I immediately switched to a 1kHz sinewave at approximately the same level (14Wpc), keeping one eye on the Audio Precision's THD+N reading and the other on the oscilloscope screen. The measured THD was around 0.7%, but of course it immediately began to rise.
I then played Daft Punk's "Get Lucky," which lasts six minutes—approximately as long as the organ recording—at a level that ranged between 3 and 16Wpc. When I switched to the sinewave, the THD this time (before it began to rise) was 0.5%.
These tests suggest that the microprocessor algorithm has been carefully arranged so that while the bias current will start to decrease with high-level music with sustained tones, the increase in THD won't be audible due to masking, and will decrease once the climax has passed. With less-demanding music that has a much higher crest factor than organ recordings or EDM, it looks as if the Ragnarok's output-stage bias remains high enough not to add distortion, and therefore will not be a significant factor in the amplifier's sound quality. As Mr. Stoddard said.—John Atkinson
Well there it is.— John Atkinson
Postscript: After the review had been laid out for print, I thought of a way of unmasking the action of the microprocessor that adjusts the output-stage bias current: Play music with high-level sustained tones for five minutes or so, then immediately examine the distortion with a sinewave tone before the microprocessor can react.
I played my recording of Jonas Nordwall playing the Toccata of Widor's Organ Symphony 5 (which has sustained organ-pedal notes) at a level that reached 20Wpc at the climax but for much of the time averaged less than 1Wpc. As soon as the musical climax finished, I immediately switched to a 1kHz sinewave at approximately the same level (14Wpc), keeping one eye on the Audio Precision's THD+N reading and the other on the oscilloscope screen. The measured THD was around 0.7%, but of course it immediately began to rise.
I then played Daft Punk's "Get Lucky," which lasts six minutes—approximately as long as the organ recording—at a level that ranged between 3 and 16Wpc. When I switched to the sinewave, the THD this time (before it began to rise) was 0.5%.
These tests suggest that the microprocessor algorithm has been carefully arranged so that while the bias current will start to decrease with high-level music with sustained tones, the increase in THD won't be audible due to masking, and will decrease once the climax has passed. With less-demanding music that has a much higher crest factor than organ recordings or EDM, it looks as if the Ragnarok's output-stage bias remains high enough not to add distortion, and therefore will not be a significant factor in the amplifier's sound quality. As Mr. Stoddard said.—John Atkinson
Fig.1 Schiit Ragnarok, frequency response at 1V into: simulated loudspeaker load (gray), 8 ohms (left channel blue, right red), 4 ohms (left cyan, right magenta), 2 ohms (green) (1dB/vertical div.).
Fig.2 Schiit Ragnarok, small-signal, 10kHz squarewave into 8 ohms.
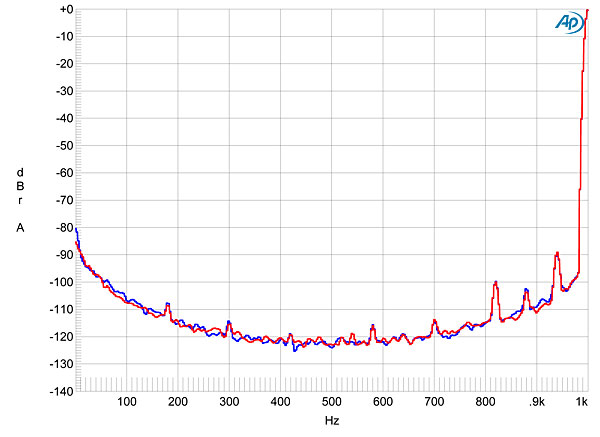
As HR noted, the Ragnarok runs warm. After the amplifier had been tested for a few hours, its front-panel temperature was 106.3°F (41.3°C), while the inset grille on the top panel measured 116.7°F (47.1°C). The channel separation was excellent, at >90dB below 1kHz and still 70dB at 20kHz. The unweighted, wideband signal/noise ratio, ref. 2.83V into 8 ohms and taken with the input shorted to ground but the volume control set to its maximum—the worst case—was good, at 83dB. Restricting the measurement bandwidth to the audioband improved the ratio slightly, to 87.5dB, while an A-weighting filter improved it further, to 100.3dB. A light "bounce" in the traces of the amplifier's noise on the oscilloscope screen suggested the presence of some very low-frequency noise; this can be seen in fig.3, which shows the low-frequency spectrum of the Ragnarok's output while it drove a 1kHz tone at 1W into 8 ohms.
Fig.3 Schiit Ragnarok, spectrum of 1kHz sinewave, DC–1kHz, at 1W into 8 ohms (linear frequency scale).
All of these measurements were performed with continuous test signals at low levels. However, when I tried testing the Ragnarok with higher-level signals, I ran into trouble. I always begin testing an amplifier by preconditioning it: running it at one-third the specified power—20Wpc in the case of the Schiit—into 8 ohms for an hour before performing any other tests. During this period I monitor the percentage of total harmonic distortion plus noise, to see if there is any significant change with the amplifier hot. The Ragnarok's THD+N started off at around 0.05%, which is what I expected, but as time went on the distortion level rose, and within five minutes had reached 34%! This was true for both channels, for both balanced and unbalanced inputs, and for all three gain settings.
Fig.4 Schiit Ragnarok, 1kHz waveform at 20Wpc into 8 ohms after 5 minutes, 34% THD+N.
Fig.5 Schiit Ragnarok, THD+N (%) vs time at 10V into 8 ohms (left channel cyan, right magenta), 3V (left blue, right red), 300mV ohms (left green, right gray), 0–200s horizontal scale.
"This is actually expected behavior," Stoddard replied. "Let me explain, now that you think we are the least competent amplifier designers on the planet. What you're seeing is the consequence of the microprocessor-managed bias algorithm we're using. Unlike other amps that use microprocessor-based protection, Ragnarok uses its microprocessor for three things: continuous bias management; overcurrent protection; stepped attenuator and input switching control.
Fig.6 Schiit Ragnarok, spectrum of 50Hz sinewave, DC–1kHz, at 1V into 8 ohms (linear frequency scale).
Fig.7 Schiit Ragnarok, spectrum of 50Hz sinewave, DC–1kHz, at 10V into 8 ohms (linear frequency scale).
Fig.8 Schiit Ragnarok, HF intermodulation spectrum, DC–30kHz, 19+20kHz at 3V peak into 8 ohms (linear frequency scale).
Similarly, when I tried examining how the percentage of THD+N changed with power with both channels driven, the resulting graph was clearly being affected by the action of the bias-adjustment algorithm. For example, fig.9 shows the behavior into 8 ohms: the steady rise in distortion between 100mW and 10W is actually due to the decreasing output-stage bias current. The amplifier does appear to clip above 40Wpc, but I don't feel that is a valid measurement. The picture was similar into 4 ohms, with the sharp rise in THD+N apparent above 65Wpc (fig.10).
Fig.9 Schiit Ragnarok, THD+N (%) vs 1kHz continuous output power into 8 ohms.
Fig.10 Schiit Ragnarok, THD+N (%) vs 1kHz continuous output power into 4 ohms.
I needed, therefore, to use a test signal that more closely resembles a musical waveform yet is still diagnostic. After some experimentation, I decided to use a 1kHz toneburst with 2000 cycles on and 18,000 cycles off (ie, 2s on and 18s off), which would keep the Ragnarok from reducing its output-stage bias. During each dead period, I would manually adjust the level of the input signal to the next higher. Rather than directly measure the THD+N percentage—2s is not really long enough for the AP's analyzer to settle and for me to note the reading—I would use FFT analysis of the amplifier's output signal to look at the levels of the second, third, and fifth harmonics at each power level.
Fig.11 Schiit Ragnarok, level of third harmonic (%)vs 1kHz toneburst output power into 8 ohms.
Herb Reichert's review reveals that he really liked the sound of the Schiit Ragnarok, so it's probable that the toneburst testing more accurately characterizes the amplifier's behavior than continuous tones. But the correlation between the output-stage bias and the properties of the signal being amplified still raises my eyebrows. The more closely music resembles a continuous tone, the more nonlinear will be the amplifier's performance.
But I'll give the final word to Jason Stoddard: "I explained what we were doing to another prominent amp designer, and he went sheet white and said, 'Um, you are completely insane. How do you differentiate bias from music?' Well, the answer was, 'Many late nights watching the microprocessor dump real-time numbers on a screen, and many iterations of code that help distinguish bias and faults from transient current draws caused by musical output.'"


