Sidebar 3: Measurements
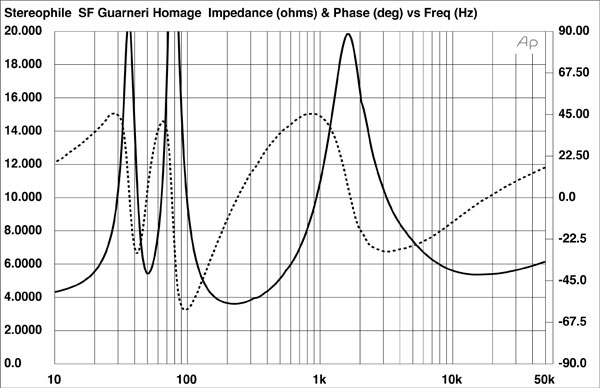
I used DRA Labs' MLSSA system and a calibrated DPA 4006 microphone to measure the Sonus Faber Guarneri Tradition's frequency response in the farfield, and an Earthworks QTC-40 for the nearfield responses. The Guarneri's sensitivity is specified as 87dB/2.83V/m; my estimate was close to this, at 86.1dB(B)/2.83V/m. How the Sonus Faber's impedance magnitude varies with frequency is shown by the solid trace in fig.1. Although it drops below 4 ohms between 160 and 340Hz, with a minimum value of 3.6 ohms at 125Hz, and there is a combination of 4.5 ohms and –38° electrical phase angle at 140Hz, the Guarneri Tradition is still a relatively easy load for the partnering amplifier to drive.
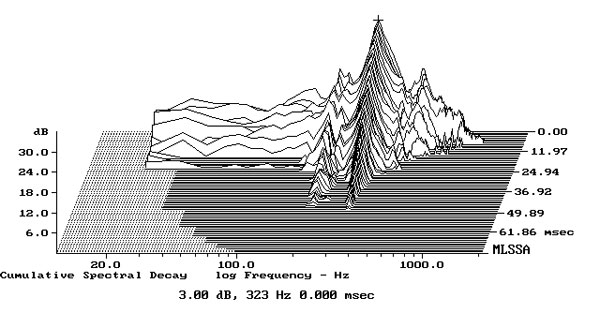
There is a slight discontinuity just above 300Hz in the fig.1 traces; when I examined the enclosure's vibrational behavior with a plastic-tape accelerometer, I did find a fairly strong mode at 323Hz on the sidewalls a few inches behind the front baffle (fig.2). It was also present, at a lower level, on the top panel, but the affected areas were fairly small, and in my listening I noticed nothing amiss in the speaker's midrange that could correlate with this measured behavior.
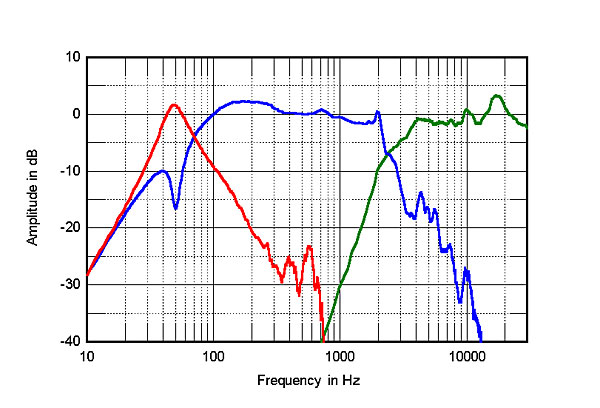
 The impedance traces suggest that the port on the speaker's rear panel is tuned to 50Hz, and the woofer's output, measured in the nearfield (fig.3, blue trace), does have its minimum-motion notch at that frequency. (This is the frequency at which the woofer cone is held stationary by the back pressure from the port resonance.) The port's output (red trace) peaks sharply between 35 and 70Hz, rolling off above that region. Though a couple of midrange peaks can be seen in its response, these are well down in level.


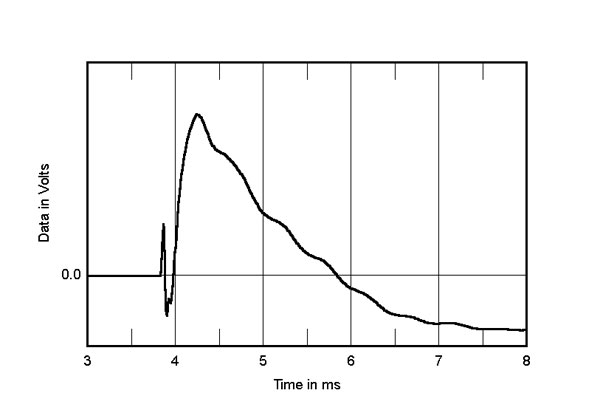
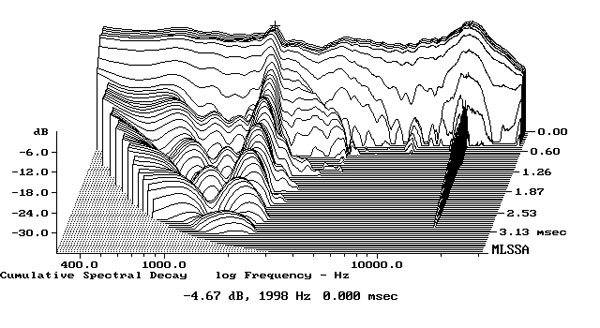
 In the time domain, the Sonus Faber's step response on the tweeter axis (fig.8) indicates that both drive-units are connected in positive acoustic polarity. This graph suggests that the best integration of the drive-unit outputs occurs just below the tweeter axis. The slight ripples in the decay of the woofer's step give rise to a significant ridge of delayed energy at 2kHz in the Guarneri's cumulative spectral-decay plot (fig.9). This may be due to a cone-surround termination problem at this frequency, and it appears to be of high Q, which will work against its audibility. The plot is otherwise very clean.
Footnote 1: Using SMUGSoftware's FuzzMeasure 3.0 program and a 96kHz sample rate, I average 20 1/6-octave–smoothed spectra, individually taken for the left and right speakers, in a rectangular grid 36" wide by 18" high and centered on the positions of my ears.
Fig.1 Sonus Faber Guarneri Tradition, electrical impedance (solid) and phase (dashed) (5 ohms/vertical div.).
Fig.2 Sonus Faber Guarneri Tradition, cumulative spectral-decay plot calculated from output of accelerometer fastened to center of sidewall (MLS driving voltage to speaker, 7.55V; measurement bandwidth, 2kHz).
Fig.3 Sonus Faber Guarneri Tradition, acoustic crossover on tweeter axis at 50", corrected for microphone response, with nearfield responses of woofer (blue) and port (red), respectively plotted in the ratios of the square roots of their radiating areas below 350Hz and 720Hz.
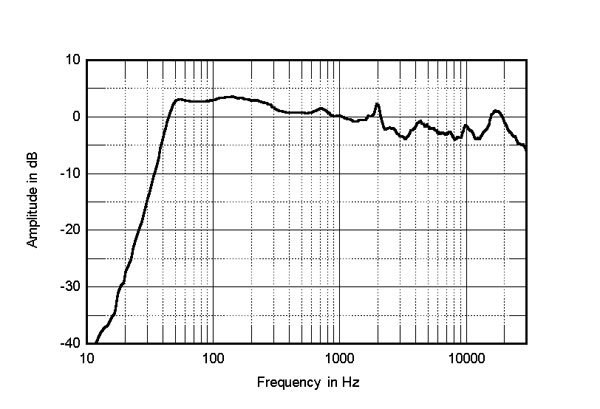
Higher in frequency in fig.3, the woofer rolls off rapidly above 2kHz, and is crossed over to the tweeter at 2.5kHz with what appear to be third-order filter slopes. In its output, however, is a small but well-defined peak at 2kHz. The tweeter's response (green trace) is relatively flat within its passband. The trace above 300Hz in fig.4 shows how these individual outputs sum in the farfield, averaged across a 30° horizontal window centered on the tweeter axis. The response is relatively even, but the peak at 2kHz can be seen; and at the other end of the spectrum, the low frequencies roll off quickly below 45Hz.
Fig.4 Sonus Faber Guarneri Tradition, anechoic response on tweeter axis at 50", averaged across 30° horizontal window and corrected for microphone response, with complex sum of nearfield woofer and port responses plotted below 300Hz.
Fig.5 shows the Guarneri Tradition's horizontal radiation pattern normalized to the tweeter-axis response, which therefore appears as a straight horizontal line. The speaker's output in the 2kHz region falls off, which will work against the audibility of that peak in the on-axis output, while the tweeter actually has slightly greater output to its sides in the mid-treble than it does on axis. The tweeter does become quite directional above 12kHz, however. In the vertical plane (fig.6), suckouts develop in the crossover region more than 5° above and 10° below the tweeter axis. Don't listen to this speaker while standing, and use its dedicated stands to place the tweeter axes close to the level of your ears when seated—although, as I found with my listening chair, the stands raised the speakers slightly too high.
Fig.5 Sonus Faber Guarneri Tradition, lateral response family at 50", normalized to response on tweeter axis, from back to front: differences in response 90–5° off axis, reference response, differences in response 5–90° off axis.
Fig.6 Sonus Faber Guarneri Tradition, vertical response family at 50", normalized to response on tweeter axis, from back to front: differences in response 45–5° above axis, reference response, differences in response 5–45° below axis.
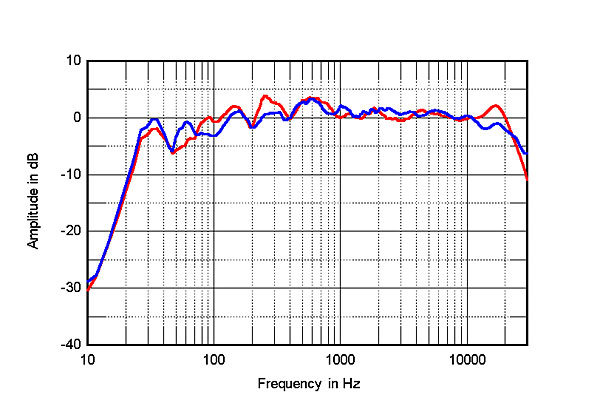
The red trace in fig.7 shows the Sonus Faber's spatially averaged response in my room, compared with that of the similarly priced TAD ME1 speakers reviewed elsewhere in this issue (blue trace, footnote 1). The two speakers' responses look superficially similar, but you can see that the three-way TAD produces a bit more midbass energy, the Sonus Faber a little more upper-bass and lower-midrange energy. The Guarneri Homage also has a more elevated top-octave response, and while that 2kHz peak in its on-axis output is still visible, it's mild in level. Incidentally, above 500Hz, where the room acoustics will have much less effect than below that frequency, the two speakers didn't match as closely as I have found with some other models, there being up to 2dB difference in their outputs at some treble frequencies.
Fig.7 Sonus Faber Guarneri Tradition, spatially averaged, 1/6-octave response in JA's listening room (red); and of TAD ME1 (blue).
Fig.8 Sonus Faber Guarneri Tradition, step response on tweeter axis at 50" (5ms time window, 30kHz bandwidth).
Fig.9 Sonus Faber Guarneri Tradition, cumulative spectral-decay plot on tweeter axis at 50" (0.15ms risetime).
There's a lot to admire in the Sonus Faber Guarneri Tradition's measured performance, but I was bothered by that small peak at 2kHz.—John Atkinson
Footnote 1: Using SMUGSoftware's FuzzMeasure 3.0 program and a 96kHz sample rate, I average 20 1/6-octave–smoothed spectra, individually taken for the left and right speakers, in a rectangular grid 36" wide by 18" high and centered on the positions of my ears.


