Sidebar 3: Measurements
I used DRA Labs' MLSSA system and a calibrated DPA 4006 microphone to measure the Sonus Faber Lumina III's frequency response in the farfield and an Earthworks QTC-40 mike to measure the nearfield and in-room responses. I measured the speaker's impedance with MLSSA, checking the results with Dayton Audio's DATS v2 system.
Sonus Faber specifies the Lumina III's sensitivity as a high 89dB/2.83V/m. My estimate was even higher, at 91dB(B)/2.83V/m. The Lumina III's impedance is specified as 4 ohms. The impedance magnitude (fig.1, solid trace) remains between 4 ohms and 8 ohms in the midrange, with minimum values of 3.3 ohms at 123Hz and 3 ohms between 450Hz and 560Hz. The electrical phase angle (dashed trace) is occasionally high when the magnitude is low. For example, there is a combination of 3.75 ohms and –43° at 110Hz. The EPDR (footnote 1) is 1.5–1.6 ohms between 96 and 120Hz and 1.6 ohms between 660Hz and 810Hz, with a minimum value of 1.25 ohms at 111Hz. The Lumina III is best used with amplifiers that don't have problems driving 4 ohm loads. In addition, with tube amplifiers that have high output impedances, the shape of the Sonus Faber's impedance magnitude trace implies that the treble will sound exaggerated.


 Higher in frequency in fig.3, the midrange unit's farfield response on the tweeter axis (green trace) is respectably flat, though the tweeter's output on this axis is boosted in the top audio octave. Averaging the Sonus Faber's farfield response across a 30° horizontal window centered on the tweeter axis lowers the output above 12kHz (fig.4) but leaves the peak at 10kHz in place. (This peak was a dB or so higher with one speaker than with the other.) The overall balance is otherwise flat. Repeating the measurement with the grille in place reduces the level between 3kHz and 7kHz by 1–2dB.
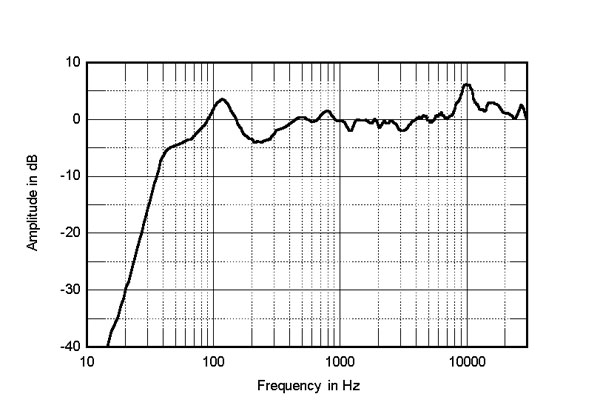 Fig.5 shows the Lumina III's horizontal dispersion, normalized to the response without the grille on the tweeter axis, which thus appears as a straight line. The loudspeaker's radiation pattern narrows at the top of the tweeter's passband, though small dips in the lower treble in the on-axis response fill in to the sides. In the vertical plane (fig.6), a suckout in the crossover region develops more than 5° above the tweeter axis; don't listen to this Sonus Faber in too high a chair.
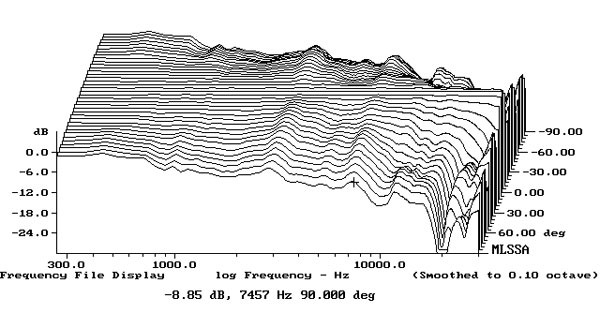
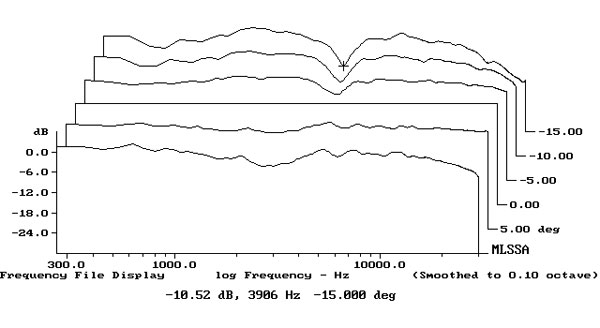 Fig.7 shows the Sonus Faber Lumina IIIs' spatially averaged response in my room. (The spatial averaging (footnote 2) averages out the peaks and dips below 400Hz that are due to the room's resonant modes.) As I was not able to place the speakers as close to the wall behind them as would be ideal, the low frequencies are shelved down with both the original positions (blue trace) and the final positions (red). However, in the Sonus Fabers' final positions, there is a little more reinforcement of their output from the lowest-frequency mode in my room. More importantly, the excess of upper-bass energy that can be seen with the speakers in the original positions was eliminated after I moved the Lumina IIIs.
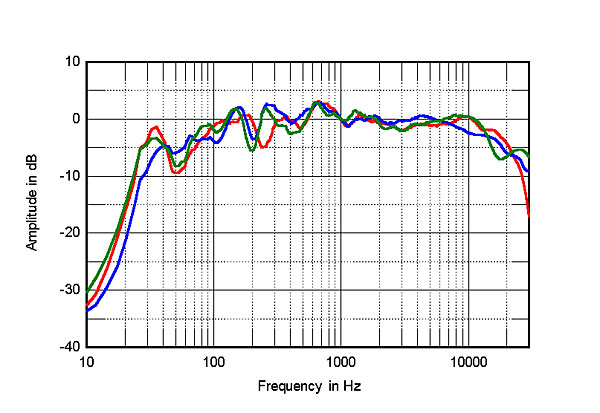
 The excess of high-treble energy can also be seen in fig.8, which compares the Lumina III's spatially averaged response (red trace) with that of the KEF LS50 Meta (blue trace), and that of the Bowers & Wilkins 705 Signature (green trace). (The KEFs and B&Ws were in very similar positions in my room; the Sonus Fabers were 7" farther away, as they had been for the red trace in fig.7.) The behavior of all three loudspeakers is very similar in the midrange—all three have a little too much in-room energy between 500Hz and 900Hz—but the Lumina IIIs have the highest high-treble output. The Sonus Fabers and B&Ws offer similar outputs between 25Hz and 40Hz, but the Lumina III's midbass is lower in level than that of the other two loudspeakers.

Footnote 1: EPDR is the resistive load that gives rise to the same peak dissipation in an amplifier's output devices as the loudspeaker. See "Audio Power Amplifiers for Loudspeaker Loads," JAES, Vol.42 No.9, September 1994, and this article by Keith Howard. Footnote 2: Using SMUGSoftware's FuzzMeasure 3.0 program and a 96kHz sample rate, I average 20 1/6-octave–smoothed spectra, individually taken for the left and right speakers, in a rectangular grid 36" wide by 18" high and centered on the positions of my ears.
Fig.1 Sonus Faber Lumina III, electrical impedance (solid) and phase (dashed) (2 ohms/vertical div.).
Although the traces in fig.1 are free from the small discontinuities that would imply the presence of resonances, when I investigated the enclosure's vibrational behavior with a plastic-tape accelerometer, I did find some resonant modes in the midrange. The strongest of these—on the sidewalls, level with the upper woofer—lay just below 500Hz (fig.2). These modes have a high Q (Quality Factor), which might mitigate any audible effects.
Fig.2 Sonus Faber Lumina III, cumulative spectral-decay plot calculated from output of accelerometer fastened to center of side panel level with upper woofer (MLS driving voltage to speaker, 7.55V; measurement bandwidth, 2kHz).
A saddle centered on 47Hz in the impedance-magnitude trace suggests that this is the tuning frequency of the port on the speaker's base. The minimum-motion notch in the woofers' summed output (fig.3, red trace; both woofers behave identically), which is when the back pressure from the port resonance holds the woofer cone still, lies close to the same frequency. The port's output (fig.3, blue trace) has one peak between 30Hz and 60Hz and another, smaller peak at 100Hz. The upper-frequency rolloff is initially clean, though some low-level liveliness can be seen between 300Hz and 700Hz. (As the port fires downward at the floor, this behavior is probably irrelevant.) The woofers hand over to the midrange unit (green trace) at the specified 350Hz; the crossover appears to use asymmetrical slopes.
Fig.3 Sonus Faber Lumina III, acoustic crossover on tweeter axis at 50", corrected for microphone response, with the nearfield responses of the midrange unit (green), woofers (red), and port (blue), respectively plotted below 450Hz, 450Hz, and 700Hz.
Fig.4 Sonus Faber Lumina III, anechoic response on tweeter axis at 50", averaged across 30° horizontal window and corrected for microphone response, with the complex sum of the nearfield midrange, woofer, and port responses plotted below 300Hz.
The black trace below 300Hz in fig.4 is the complex sum of the nearfield midrange, woofer, and port responses, with the latter's acoustic phase compensated for by the fact that the port is on the base. There is the usual peak in the upper bass due to the nearfield measurement technique. While the port extends the Lumina III's output to just below the reflex tuning frequency, the midbass is shelved down a little. This suggests that the Lumina III will provide optimal low-frequency reproduction when it is placed fairly close to the wall behind it.
Fig.5 Sonus Faber Lumina III, lateral response family at 50", normalized to response on tweeter axis, from back to front: differences in response 90–5° off axis, reference response, differences in response 5–90° off axis.
Fig.6 Sonus Faber Lumina III, vertical response family at 50", normalized to response on tweeter axis, from back to front: differences in response 15–5° above axis, reference response, differences in response 5–10° below axis.
Fig.7 Sonus Faber Lumina III, spatially averaged, 1/6-octave response in JA's listening room with speakers in original positions (blue) and final positions (red).
A loudspeaker that offers flat on-axis response and well-controlled lateral dispersion gives a gently sloped-down treble in the spatially averaged room response due to the increased absorption of the room's furnishings at high frequencies. By that criterion, the Lumina III produces a little too much energy in-room in the top two audio octaves, especially in the original positions in my room, where the spectrum includes a little less of the reverberant field energy.
Fig.8 Sonus Faber Lumina III, spatially averaged, 1/6-octave response in JA's listening room (red), of the KEF LS50 Meta (blue), and of the Bowers & Wilkins 705 Signature (green).
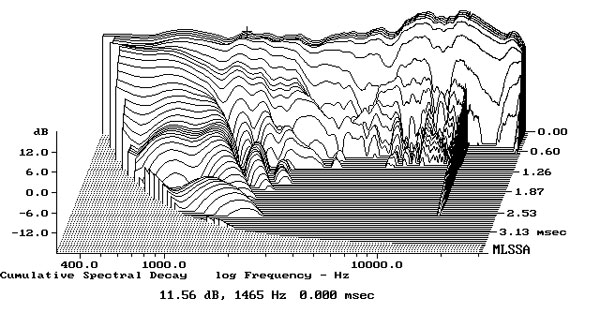
In the time domain, the Lumina III's step response on the tweeter axis (fig.9) reveals that the tweeter and midrange unit are connected in inverted acoustic polarity, the woofers in positive polarity. The decay of the tweeter's step smoothly blends with the negative-going start of the midrange unit's step, and the decay of the midrange unit's step almost blends smoothly with the positive-going start of the woofers' step. This graph suggests that the optimal blend of all three outputs will occur just below the tweeter axis. The Lumina III's cumulative spectral-decay plot (fig.10) is relatively clean.
Fig.9 Sonus Faber Lumina III, step response on tweeter axis at 50" (5ms time window, 30kHz bandwidth).
Fig.10 Sonus Faber Lumina III, cumulative spectral-decay plot on tweeter axis at 50" (0.15ms risetime).
The Sonus Faber Lumina III offers generally excellent measured performance for its price.—John Atkinson
Footnote 1: EPDR is the resistive load that gives rise to the same peak dissipation in an amplifier's output devices as the loudspeaker. See "Audio Power Amplifiers for Loudspeaker Loads," JAES, Vol.42 No.9, September 1994, and this article by Keith Howard. Footnote 2: Using SMUGSoftware's FuzzMeasure 3.0 program and a 96kHz sample rate, I average 20 1/6-octave–smoothed spectra, individually taken for the left and right speakers, in a rectangular grid 36" wide by 18" high and centered on the positions of my ears.