Sidebar 3: Measurements
I measured the T+A DAC 8 DSD with my Audio Precision SYS2722 system (see the January 2008 "As We See It"). Sources were either digital signals fed via AES/EBU or TosLink from the SYS2722, or WAV and AIFF test-tone files played with Pure Music 3.0 on my MacBook Pro running on battery power and fed via USB. Apple's USB Prober utility identified the processor as the "DAC 8 DSD HD-AUDIO" from "T+A ELEKTROAKUSTIK," and confirmed that the T+A's USB input operated in the optimal isochronous asynchronous mode. The AES/EBU and S/PDIF inputs accepted data sampled at up to 192kHz. Apple's AudioMIDI app indicated that the T+A DAC operated at all PCM sample rates from 32 to 384kHz via USB, with bit depths of up to 32. The DAC 8 successfully decoded DSD64 and DSD128 data fed it via USB from the MacBook. I left the Clean/Wide switch in the Wide position for all the measurements.
The T+A's volume control operates in steps of 1.25dB. The maximum levels with 44.1kHz data were 4.36V from the balanced output, 2.175V from the unbalanced output, and 6V from the headphone output, all with correct absolute polarity. The balanced output impedance at 20Hz was higher than the specified 44 ohms but still low at 114 ohms, dropping slightly to 104 ohms at higher frequencies; the unbalanced impedance was 53 ohms at 20Hz, 48 ohms at 1kHz, and 46 ohms at 20kHz; the headphone output impedance was 23 ohms at all audio frequencies, which is a bit higher than is optimal for driving low-impedance 'phones. (The DAC 8's manual doesn't recommend using it with headphones of less than 30 ohms impedance.)
Measuring the DAC 8 with PCM data was complicated by the fact that there are four options of digital reconstruction filter, displayed on the front panel as "FIR1," "FIR2," "Bez1," and "Bez2." Figs. 1–4 show the impulse response of each filter with 44.1kHz data. FIR1/Filter 1 (Standard FIR, fig.1) is typical of a conventional Finite Impulse Response filter, with symmetrical ringing to either side of the single 0dBFS example; FIR2/Filter 2 (the Impulse Optimized filter, fig.2) is similar, but with fewer coefficients; Bez1/Filter 3 (the Bézier Interpolator plus IIR, fig.3) is a very short asymmetrical filter similar to that used by Ayre Acoustics in its QB-9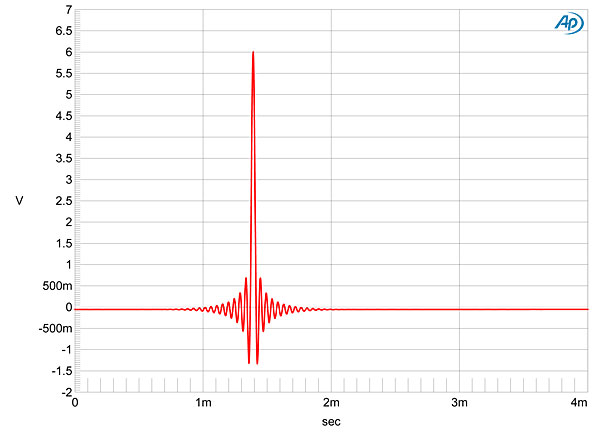


 I haven't shown the frequency responses with FIR1 and FIR2, which are flat almost to the Nyquist frequency (half of each sample rate). But Bez1 and Bez2 offered some anomalous behavior. Fig.9 shows the response with PCM data sampled at 44.1, 96, and 192kHz and with the responses normalized to eliminate the level difference noted above. Some peaking is evident in the top two audio octaves at the two lower rates before the expected rolloff. Only at 192kHz does the ultrasonic content roll off as expected, though this occurs somewhat below the 96kHz Nyquist frequency. With data at 384kHz (not shown) the output is down by 2.5dB at 100kHz, and by 10dB at 168kHz. No peaking is evident with the Bez2 filter (fig.10), but the earlier rolloff is evident at all three rates, with the output at 20kHz down by almost 3dB with 44.1kHz data (green and gray traces).

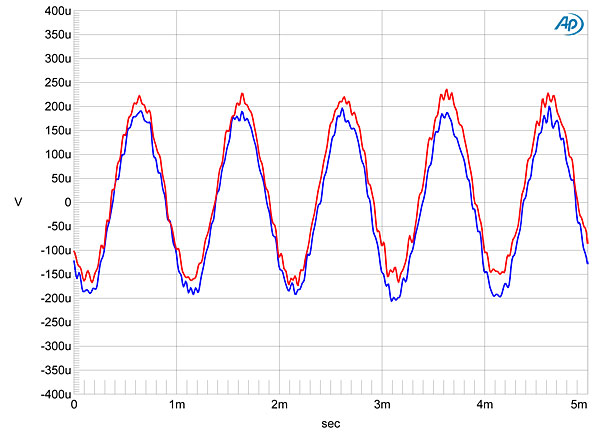
 The DAC 8's noise floor was free from any power-supply–related spuriae (fig.11), and channel separation was superb, at >125dB below 1kHz and still 113dB at 20kHz. Increasing the bit depth from 16 to 24 with a dithered 1kHz tone at –90dBS dropped the noise floor by >20dB, which implies resolution of almost 20 bits (fig.12). This is superb resolution, and was not affected by the choice of filter. One puzzle: This graph was taken with AES/EBU data, and the 24-bit tone is accompanied by odd-order harmonics. These harmonics were absent when I repeated the test with USB data (fig.13), which makes me wonder if, with AES/EBU data, the 24th bit was being truncated. Nevertheless, with undithered 16-bit data at precisely –90.31dBFS, the waveform was accurately reproduced (fig.14), with symmetry, three clearly defined DC voltage levels, and negligible DC offset. With undithered 24-bit data, the result was a good sinewave (fig.15).


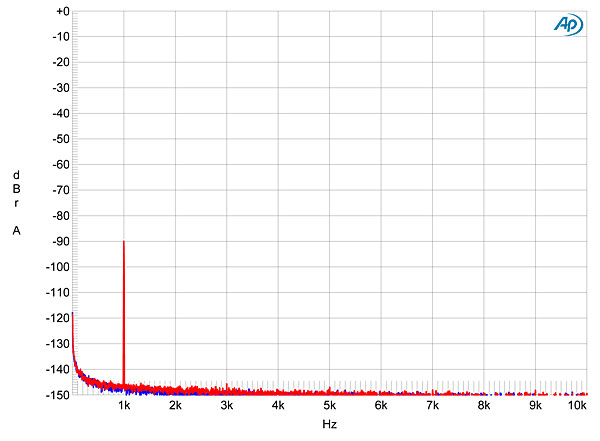

 Into high impedances, the DAC 8 DSD offered low levels of distortion. Fig.16 was taken with the balanced output driving a full-scale 50Hz tone into 100k ohms. The second harmonic is the highest in level, at –100dB (0.001%), and although some higher-order harmonics can be seen, these are even lower in level. The T+A's line outputs were less happy with the punishing 600 ohm load; the level of the tone had to be reduced by 3dB to bring distortion down to an acceptably low level. The headphone output had no problem with low impedances; at full volume into 33 ohms, the third harmonic was the highest in level, at –90dB (0.003%, fig.17).

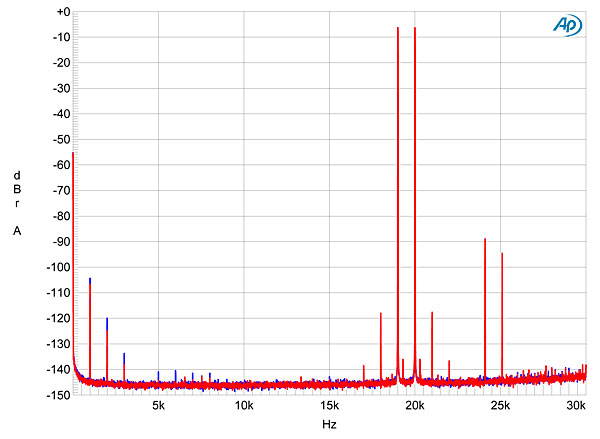
 Tested with an equal mix of 19 and 20kHz tones, and with the combined waveform peaking at 0dBFS, the DAC 8 DSD's behavior depended on the filter selected. Fig.18 shows the spectrum of its balanced output with filter FIR1. Intermodulation distortion is negligible, and the highest-level spuriae are the sampling images at 24.1 and 25.1kHz. FIR2 gave a messy-looking audioband spectrum (not shown), as expected from fig.6, and while filters Bez1 and Bez2 (fig.19) showed similarly worse rejection of these images, intermodulation was still extremely low. The headphone output had slightly higher intermodulation, but with the 1kHz difference product at –96dB (0.0015%), this is still extremely low in absolute terms.
 Finally, the T+A DAC 8 DSD offered superb rejection of word-clock jitter via its PCM inputs. Fig.20 was taken with TosLink-sourced 16-bit J-Test data: no spurious sidebands can be seen, and the odd-order harmonics of the low-frequency, LSB-level squarewave are all at the correct level, as shown by the green overlay.

Footnote 1: Jon Iverson did comment that he felt this filter made the DAC 8 sound similar to the Ayre processors; see fig.1 here. Footnote 2: My thanks to Jürgen Reis, of MBL, for suggesting this test to me.
Fig.1 T+A DAC 8, FIR1 impulse response (one sample at 0dBFS, 44.1kHz sampling, 4ms time window).
Fig.2 T+A DAC 8, FIR2, impulse response (one sample at 0dBFS, 44.1kHz sampling, 4ms time window).
Fig.3 T+A DAC 8, Bez1, impulse response (one sample at 0dBFS, 44.1kHz sampling, 4ms time window).
Fig.4 T+A DAC 8, Bez2, impulse response (one sample at 0dBFS, 44.1kHz sampling, 4ms time window).
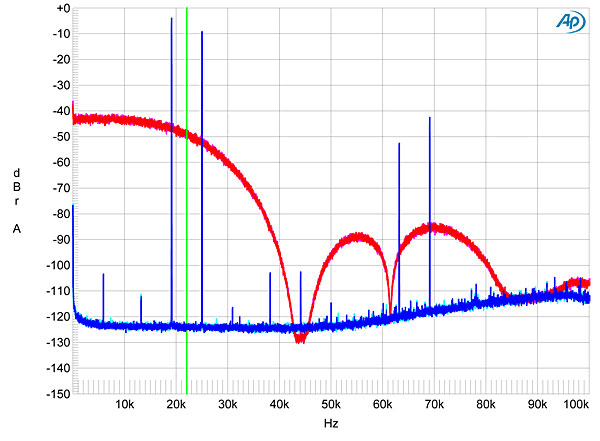
Figs.5–8 show the frequency-domain behavior of the four filters with the DAC 8 fed 24/44.1 PCM data representing a 19.1kHz tone at 0dBFS and white noise at –4dBFS (footnote 2). FIR1 (fig.5) features a very sharp rolloff above the audioband, with the level of the image at 25kHz of the 19.1kHz tone suppressed by almost 90dB. Though the second and fourth harmonics of the tone can be seen, they are very low in level. By contrast, FIR2 (fig.6) features a very slow ultrasonic rolloff, with the 25kHz image suppressed by just 15dB and a large number of aliasing components present in the audioband. With this filter, the DAC 8 offers similar behavior to the "NOS" DACs whose sound some audiophiles adore. Bez1 (fig.7) offers a slow rolloff and poor image suppression similar to those of FIR2, but without the audioband aliasing. Bez2 (fig.8) offers a slower rolloff starting at 10kHz, with a sharply defined null at the sample rate.
Fig.5 T+A DAC 8, FIR1, wideband spectrum of white noise at –4dBFS (left channel red, right magenta) and 19.1kHz tone at 0dBFS (left blue, right cyan), with data sampled at 44.1kHz (20dB/vertical div.).
Fig.6 T+A DAC 8, FIR2, wideband spectrum of white noise at –4dBFS (left channel red, right magenta) and 19.1kHz tone at 0dBFS (left blue, right cyan), with data sampled at 44.1kHz (20dB/vertical div.).
Fig.7 T+A DAC 8, Bez1, wideband spectrum of white noise at –4dBFS (left channel red, right magenta) and 19.1kHz tone at 0dBFS (left blue, right cyan), with data sampled at 44.1kHz (20dB/vertical div.).
Fig.8 T+A DAC 8, Bez2, wideband spectrum of white noise at –4dBFS (left channel red, right magenta) and 19.1kHz tone at 0dBFS (left blue, right cyan), with data sampled at 44.1kHz (20dB/vertical div.).
Fig.9 T+A DAC 8, Bez1, frequency response at –12dBFS into 100k ohms with data sampled at: 44.1kHz (left channel green, right blue), 96kHz (left cyan, right magenta), 192kHz (left blue, right red) (1dB/vertical div.).
Fig.10 T+A DAC 8, Bez2, frequency response at –12dBFS into 100k ohms with data sampled at: 44.1kHz (left channel green, right blue), 96kHz (left cyan, right magenta), 192kHz (left blue, right red) (1dB/vertical div.).
Fig.11 T+A DAC 8, spectrum of 1kHz sinewave, DC–1kHz, at 0dBFS into 100k ohms (left channel blue, right red; linear frequency scale).
Fig.12 T+A DAC 8, 44.1kHz data, spectrum with noise and spuriae of dithered 1kHz tone at –90dBFS with: 16-bit data (left channel cyan, right magenta), 24-bit data (left blue, right red) (20dB/vertical div.).
Fig.13 T+A DAC 8, 44.1kHz data, spectrum with noise and spuriae of dithered 1kHz tone at –90dBFS with 24-bit USB data (left blue, right red) (20dB/vertical div.).
Fig.14 T+A DAC 8, FIR1, waveform of undithered 1kHz sinewave at –90.31dBFS, 16-bit data (left channel blue, right red).
Fig.15 T+A DAC 8, FIR1, waveform of undithered 1kHz sinewave at –90.31dBFS, 24-bit data (left channel blue, right red).
Fig.16 T+A DAC 8, spectrum of 50Hz sinewave, DC–1kHz, at 0dBFS into 100k ohms (left channel blue, right red; linear frequency scale).
Fig.17 T+A DAC 8, headphone output, spectrum of 50Hz sinewave, DC–1kHz, at 0dBFS into 100k ohms (left channel blue, right red; linear frequency scale).
Fig.18 T+A DAC 8, FIR1, HF intermodulation spectrum, DC–30kHz, 19+20kHz at 0dBFS into 100k ohms, 44.1kHz data (left channel blue, right red; linear frequency scale).
Fig.19 T+A DAC 8, Bez2, HF intermodulation spectrum, DC–30kHz, 19+20kHz at 0dBFS into 100k ohms, 44.1kHz data (left channel blue, right red; linear frequency scale).
Fig.20 T+A DAC 8, high-resolution jitter spectrum of analog output signal, 11.025kHz at –6dBFS, sampled at 44.1kHz with LSB toggled at 229Hz: 16-bit TosLink data (left channel blue, right red). Center frequency of trace, 11.025kHz; frequency range, ±3.5kHz.
Measuring the T+A DAC 8 DSD, I was reminded of something David Rich, erstwhile reviewer for The Audio Critic, wrote at the beginning of this century: "Eventually all we'll be doing is writing about the sounds of digital filters." With the DAC 8 DSD's measured behavior and sound quality so dependent on which of its four digital filters is in use, it's difficult to make any absolute value judgment. But I'm not surprised that JI liked the sound of the Bez1 filter, which seems to give the best balance between its measured parameters.—John Atkinson
Footnote 1: Jon Iverson did comment that he felt this filter made the DAC 8 sound similar to the Ayre processors; see fig.1 here. Footnote 2: My thanks to Jürgen Reis, of MBL, for suggesting this test to me.


