Sidebar 3: Measurements
I used DRA Labs' MLSSA system and a calibrated DPA 4006 microphone to measure the TAD Micro Evolution One's frequency response in the farfield, and an Earthworks QTC-40 for the nearfield responses. My estimate of the TAD's sensitivity was 86.2dB(B)/2.83V/m, slightly higher than the specified figure of 85dB. Fig.1 shows how the impedance and electrical phase vary with frequency. Though the impedance has a minimum value of 3.9 ohms between 120 and 155Hz, and there's a combination of 5 ohms and –43° phase angle at 33Hz, the ME1 is a relatively easy load for amplifiers to drive.
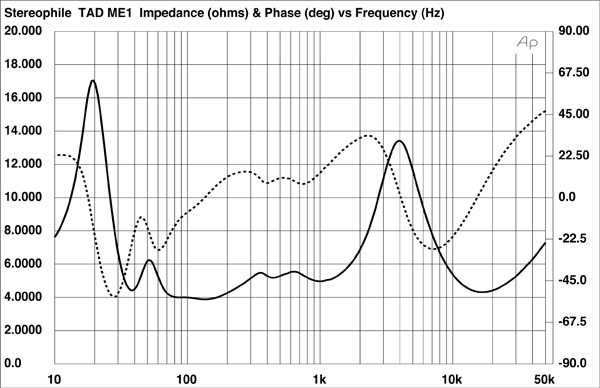

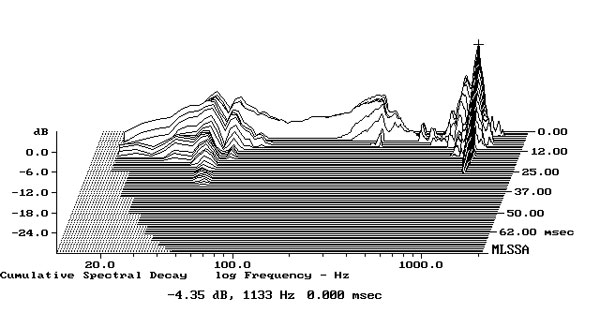
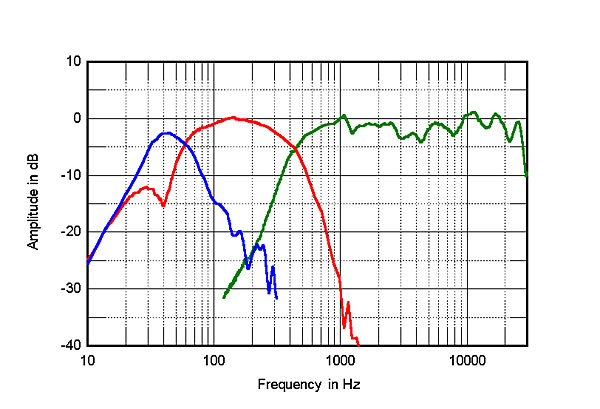 Fig.5 shows how the outputs of the individual drive-units sum in the farfield, with the response averaged across a 30° horizontal window centered on the tweeter axis. The usual rise in output in the upper bass due to the nearfield measurement technique is very slight, suggesting that the TAD's woofer alignment is overdamped. And, as TJN found, the output rolls off rapidly below 50Hz. Higher in frequency, the slight discontinuity in the upper midrange is still apparent, and while the treble response is even, it appears to slope down slightly in the top octave compared with the trace in fig.3. The horizontal off-axis behavior (fig.6) is both even and very well-controlled, which tends to correlate with stable, accurate stereo imaging. However, the ME1 does become more directional than usual above 8kHz, explaining the difference between the traces in figs. 3 and 4 in the top audio octave. In the vertical plane (fig.7), the tweeter again becomes directional above 8kHz, but the speaker otherwise maintains its balance over a wide window.
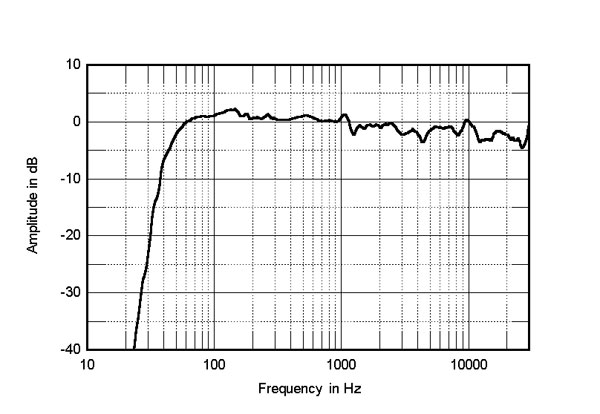


Fig.1 TAD Micro Evolution One, electrical impedance (solid) and phase (dashed) (5 ohms/vertical div.).
The traces in fig.1 are free from the small discontinuities that would suggest the presence of panel resonances. However, when I investigated the enclosure's vibrational behavior with a plastic-tape accelerometer, I did find a mode at 367Hz on the metal plates that cover the sidewalls (fig.2), though this was not present on other surfaces to any significant extent. Also visible in this graph is a lower-level mode at 1130Hz; this was more pronounced on the top panel (fig.3). As both the frequency and the Q (Quality factor) of this resonance are high, I doubt it will have any audible consequences.
Fig.2 TAD Micro Evolution One, cumulative spectral-decay plot calculated from output of accelerometer fastened to center of sidewall (MLS driving voltage to speaker, 7.55V; measurement bandwidth, 2kHz).
Fig.3 TAD Micro Evolution One, cumulative spectral-decay plot calculated from output of accelerometer fastened to center of top panel (MLS driving voltage to speaker, 7.55V; measurement bandwidth, 2kHz).
Tom Norton speculated that the woofer alignment was aperiodic in nature rather than being a traditional reflex (ported) tuning. The blue trace in fig.4 shows the summed output of the four slots to the front and rear of the metal plates on the ME1's sides. It peaks at 40Hz, as suggested by the impedance traces in fig.1, which coincides with the frequency of the notch in the woofer's output (red trace), as is to be expected with a traditional reflex tuning. The slots roll off above their passband, but don't fully support the woofer's midbass output. The crossover between the woofer and the coaxial drive-unit (blue trace) appears to be set at 440Hz, with fairly steep high- and low-pass filter slopes. The coaxial unit's response on the tweeter axis is relatively flat, though small peaks and dips can be seen throughout the treble, these perhaps due to spatially symmetrical reflections of the tweeter's output from the edges of the midrange diaphragm. There is also a slight discontinuity just above 1kHz in the midrange diaphragm's output.
Fig.4 TAD Micro Evolution One, acoustic crossover on tweeter axis at 50", corrected for microphone response, with nearfield responses of midrange unit (green), woofer (red), and port (blue), respectively plotted in the ratios of the square roots of their radiating areas below 350Hz, 1200Hz, and 230Hz.
Fig.5 TAD Micro Evolution One, anechoic response on tweeter axis at 50", averaged across 30° horizontal window and corrected for microphone response, with complex sum of nearfield woofer and port responses plotted below 300Hz.
Fig.6 TAD Micro Evolution One, lateral response family at 50", normalized to response on tweeter axis, from back to front: differences in response 90–5° off axis, reference response, differences in response 5–90° off axis.
Fig.7 TAD Micro Evolution One, vertical response family at 50", normalized to response on tweeter axis, from back to front: differences in response 45–5° above axis, reference response, differences in response 5–45° below axis.
In the time domain, the speaker's step response on the tweeter axis (fig.8) indicates that all drive-units are connected in positive acoustic polarity. Although the tweeter's output leads that of the midrange, which in turn leads that of the woofer, their outputs meld well, suggesting optimal crossover implementation. The cumulative spectral-decay plot on the tweeter axis (fig.9) is generally clean.
Fig.8 TAD Micro Evolution One, step response on tweeter axis at 50" (5ms time window, 30kHz bandwidth).
Fig.9 TAD Micro Evolution One, cumulative spectral-decay plot on tweeter axis at 50" (0.15ms risetime).
Other than its limited low frequencies, TAD's Micro Evolution One offered excellent measured performance, not dissimilar to that of TAD's pricey Compact Reference CR1, though with reduced low-frequency extension. I am not surprised that TJN was impressed by its sound quality.—John Atkinson


