Sidebar 2: Measurements
Looking first at the Studio 1's impedance, measured using the magazine's Audio Precision System One (fig.1), this suggests that the speaker is an easy load to drive, only nearing 6 ohms in the upper bass. The port/line tuning lies at 30Hz, indicated by the minimum at that frequency. Note, however, the glitch in impedance around 130Hz, which the phase response (dashed line) suggests is due to a resonance, presumably due to the transmission line, and which could correlate with my feelings about a "lumpy" response in this region.


 In-room, the bass does indeed extend down to 30Hz, as shown by the 1/3-octave curve in fig.5. This is calculated from 20 individual spectra measured at different points in a 72"-wide by 18"-high window around the listening position, and has proven to give a good correlation with a loudspeaker's perceived tonal balance. The spatial averaging almost completely removes the effects of low-frequency room resonances, yet two strong peaks are apparent in this trace: one centered on 700Hz, as implied by the listening tests, and the lower centered on the 125Hz band, not uncoincidentally the same frequency as the resonance indicated on the impedance plot. Above 1kHz, however, the response is commendably flat.

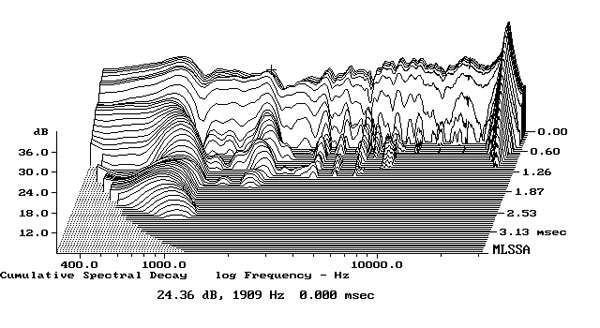
Fig.1 TDL Studio 1, electrical impedance (solid) and phase (dashed) (2 ohms/vertical div.).
Turning to the Studio 1's impulse response as calculated by the MLSSA system from DRA Labs, this—taken with a 30kHz bandwidth on the 36"-high listening axis at a 48" distance—is shown in fig.2. Although overlaid with ultrasonic ringing from the tweeter, the step response calculated from the impulse (fig.3) confirms that both drive-units are connected with the same polarity.
Fig.2 TDL Studio 1, impulse response on listening axis at 48" (5ms time window, 30kHz bandwidth).
Fig.3 TDL Studio 1, step response on listening axis at 48" (5ms time window, 30kHz bandwidth).
Windowing the impulse response as shown in fig.2 removes reflections of the impulse from the room boundaries; thus performing an FFT calculation will give the speaker's anechoic response on that axis, as can be seen on the righthand side of fig.4. Due to the windowing, the resolution of this curve is just under 200Hz. Nevertheless, features to be noted include the peak in the midrange centered on 710Hz, the crossover notch on this slightly too high axis between 2kHz and 3kHz, as well as the overall rising trend in the treble, broken up by what are cancellations probably due to interference with the direct sound by reflections of that sound from nearby obstructions, culminating in the tweeter "oil-can" resonance at 24,950Hz. (Though this looks alarming, it's inaudible.)
Fig.4 TDL Studio 1, anechoic response on listening axis at 48", corrected for microphone response, with nearfield woofer and port responses.
Repeating this measurement on the tweeter axis—an unrealistically low listening height—gives a more even treble balance, the crossover notch filling in, though the midrange peak is still noticeable.
The lefthand side of fig.4 shows a composite of the woofer and port/line output responses derived from nearfield measurements. The woofer rolls off below 65Hz, reaching its half-power point ref. 100Hz at 42Hz, the frequency of the bottom notes of the four-string double and electric basses, but it can be seen that the woofer output does continue to rise in the upper bass. The port output is centered on its tuning frequency, 30Hz, with half-power limits at 20Hz and 90Hz.
Fig.5 TDL Studio 1, spatially averaged, 1/6-octave response in JA's Santa Fe listening room.
The individual measurements taken to derive this in-room response suggest that listening too high to the Studio 1 does result in a significant lack of energy between 1250Hz and 3kHz, audible as a "hollow" quality.
The "waterfall" or cumulative spectral display plot produced by MLSSA and shown from 200Hz to 30kHz in fig.6 reveals, of course, the ultrasonic tweeter resonance smoothly decaying with time. Apart from that, the entire tweeter region decays very quickly, reinforcing the subjective impression that the treble is basically clean-sounding. The midrange, however, does have a number of resonant modes apparent, presumably mainly due to the woofer. The cursor in fig.18 is positioned at what turns out to be a reasonably strong mode at 1953Hz, though the most persistent (and audible) is the lower one at 710Hz. Unlike the version used by Acoustic Energy in the AE2, this tweeter does have some minor resonances noticeable in this plot between 4 and 10kHz. What I find interesting is that the best-defined of these, at 7kHz, actually makes its presence known as a suckout in the anechoic response (the curve at time zero), showing just how hard it is to distinguish between resonant and interference effects in a traditional frequency-response curve.—John Atkinson
Fig.6 TDL Studio 1, cumulative spectral-decay plot on tweeter axis at 48" (0.15ms risetime).


