Measurements Wired
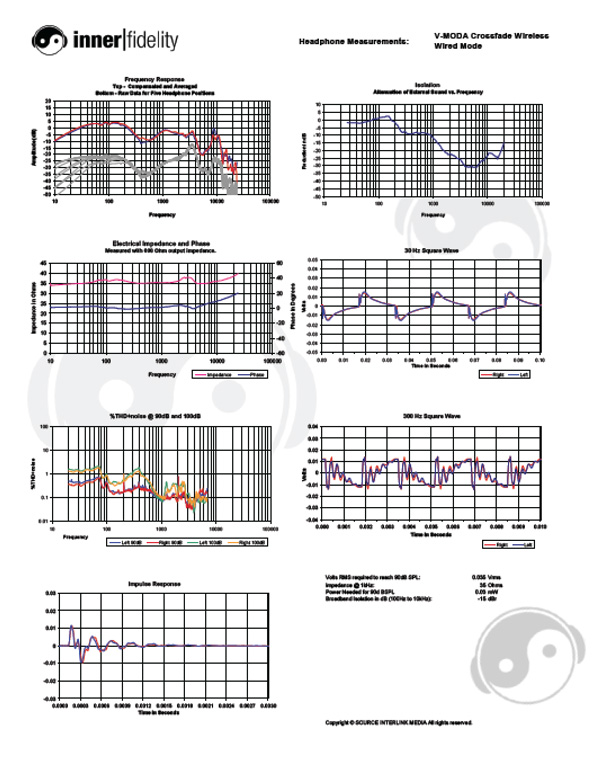
 Ideally, after the peak at 3.5kHz response should roll-off at an ever increasing rate such that it crosses baseline at about 10kHz. Obviously, the Crossfade Wireless shows a rather uneven treble response, with a significant notch at 6-8kHz, and a significant peak at 10kHz. The 6-8kHz notch, though inaccurate, is sometimes a good thing as it reduces the tendency for piercing treble response. The elevated response at 10kHz helps give the impression that treble response is at an appropriate level even though it's too low at 6-8kHz.
My take is that the frequency response profile here has roughly a good shape, it's just that it's significantly over emphasized. As an example of a headphone that has a very similar shape, but with an appropriate amount of emphasis, I suggest having a look at the Master & Dynamic MH 40 measurements. Another interesting observation is that V-MODA does have strong relationships to the DJ world, and the latest Sennheiser DJ headphones were specifically tuned for that activity. There is a fairly strong resemblance between the V-MODA full size headphones response and the Sennheiser HD 8DJ, for example. So the tuning of V-MODA headphones may be due in part to their familiarity with using headphones in a DJ environment.
30Hz square wave plots show a significant sway back shape, which echoes the bass hump of the headphones. The wireless measurements show the tale of the waveform below zero while the wired measurements have the tale at zero. Because I don't see any significant differences at the low end of the frequency response or THD+noise plots, I see this as possible evidence of phase shift due to capacitive coupling of the internal amplifier, but I'm just guessing here.
Both 30Hz and 300Hz square waves show the headphone switches polarity when switching modes. The wired mode has proper non-inverted response.
Impulse response and 300Hz square wave show significant noise after the first transient edge, which can be expected with the uneven treble response seen elsewhere.
THD+noise plots indicate a couple of things to me. The 100dB plot is above the 90dB plot in the wired mode, indicating it my have poor power handling capability. And the 90dB plot is much higher wireless measurement than the wired measurement, which may indicate the noise I heard in the headphones when active.
The wired measurements show a headphone with a 35 Ohm impedance, having a broad primary driver resonance hump centered at about 100Hz.
Isolation in both modes is nearly identical at about average for this type of headphone with -15dBspl broadband reduction.
At 35mVrms needed to achieve 90dB at the ear in wired mode, these headphones are fairly sensitive and will be driven to solid listening levels with portable devices.
Ideally, after the peak at 3.5kHz response should roll-off at an ever increasing rate such that it crosses baseline at about 10kHz. Obviously, the Crossfade Wireless shows a rather uneven treble response, with a significant notch at 6-8kHz, and a significant peak at 10kHz. The 6-8kHz notch, though inaccurate, is sometimes a good thing as it reduces the tendency for piercing treble response. The elevated response at 10kHz helps give the impression that treble response is at an appropriate level even though it's too low at 6-8kHz.
My take is that the frequency response profile here has roughly a good shape, it's just that it's significantly over emphasized. As an example of a headphone that has a very similar shape, but with an appropriate amount of emphasis, I suggest having a look at the Master & Dynamic MH 40 measurements. Another interesting observation is that V-MODA does have strong relationships to the DJ world, and the latest Sennheiser DJ headphones were specifically tuned for that activity. There is a fairly strong resemblance between the V-MODA full size headphones response and the Sennheiser HD 8DJ, for example. So the tuning of V-MODA headphones may be due in part to their familiarity with using headphones in a DJ environment.
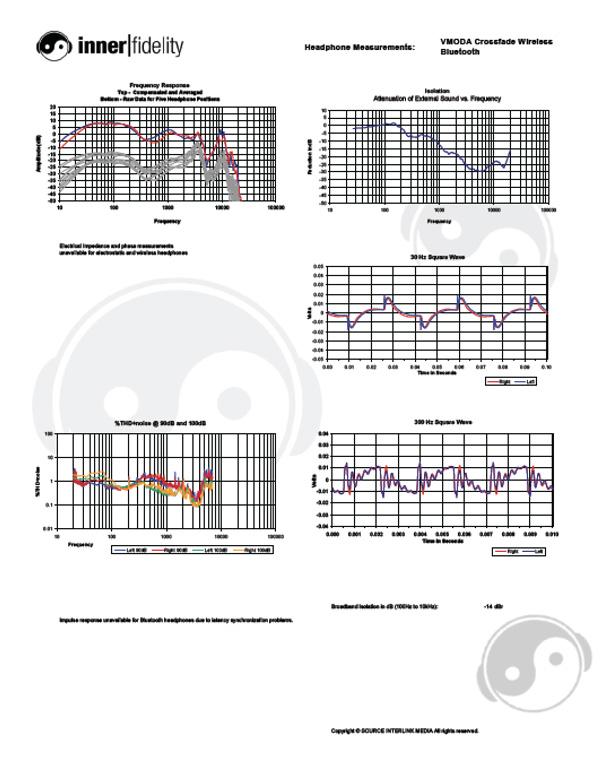
30Hz square wave plots show a significant sway back shape, which echoes the bass hump of the headphones. The wireless measurements show the tale of the waveform below zero while the wired measurements have the tale at zero. Because I don't see any significant differences at the low end of the frequency response or THD+noise plots, I see this as possible evidence of phase shift due to capacitive coupling of the internal amplifier, but I'm just guessing here.
Both 30Hz and 300Hz square waves show the headphone switches polarity when switching modes. The wired mode has proper non-inverted response.
Impulse response and 300Hz square wave show significant noise after the first transient edge, which can be expected with the uneven treble response seen elsewhere.
THD+noise plots indicate a couple of things to me. The 100dB plot is above the 90dB plot in the wired mode, indicating it my have poor power handling capability. And the 90dB plot is much higher wireless measurement than the wired measurement, which may indicate the noise I heard in the headphones when active.
The wired measurements show a headphone with a 35 Ohm impedance, having a broad primary driver resonance hump centered at about 100Hz.
Isolation in both modes is nearly identical at about average for this type of headphone with -15dBspl broadband reduction.
At 35mVrms needed to achieve 90dB at the ear in wired mode, these headphones are fairly sensitive and will be driven to solid listening levels with portable devices.
Click on graphs image to download .pdf for closer inspection.
Measurements Wireless
Click on graphs image to download .pdf for closer inspection.
Wired and wireless raw frequency response plots show significant similarity between these two modes of operation. I don't have any explanation for the observation that there is significantly more change in level during headphone movement across the entire frequency range in the wireless mode.
Both plots show bass emphasis starting at about 400Hz, which grows to about 13dB of emphasis (relative to the level at 500Hz) in a broad hump centered at around 100Hz. This is about 8dB too much emphasis, and it should be back to baseline at least an octave lower than 400Hz.
The rising response after the bass emphasis is probably a good thing, as is the fact that the peak of that rise is centered at 3.5kHz, but the peak is again far to emphatic (about 22dB above baseline) to be considered neutral (which would be about 12-15dB).


