Sidebar 3: Measurements
I tested the Vincent SV-737 with my Audio Precision SYS2722 system (see the January 2008 "As We See It"). I first preconditioned the amplifier by following the CEA's recommendation, operating it at one-eighth the specified power into 8 ohms for 30 minutes. At the end of that time, the top panel was warm, at 104.6°F (40.3°C), and the heatsinks hotter, at 113.9°F (45.5°C). I then performed my usual thermal stress test by running the amplifier at one-third power into 8 ohms for an hour. At the end of this time, the heatsinks' temperature had risen to 121.3°F (49.6°C). The Vincent amplifier has enough thermal capacity for its power rating, though, due to the significant biasing of its output stage into class-A, it runs warm. Be sure to give this amplifier sufficient ventilation.
I looked first at the Vincent's performance via its line inputs. The maximum gain at the speaker was 34.3dB into 8 ohms, which is a little lower than usual for an integrated amplifier. The maximum gain at the unbalanced preamplifier outputs was 9.54dB, and at the headphone jack it was 35.1dB. Measured at the power amplifier inputs, which bypass the preamplifier section, the gain was 35.5dB into 8 ohms. The amplifier inverted absolute polarity at the loudspeaker outputs but preserved it at the preamplifier and headphone outputs.
The single-ended line input impedance was lower than the specified 47k ohms but was still relatively high at 22.7k ohms at 20Hz and 1kHz, 21.7k ohms at 20kHz. The power amplifier input impedance was closer to the specification, at 45.4k ohms. The preamplifier output impedance was a low 90 ohms in the midrange and treble, rising to 121 ohms in the low bass, presumably due to the presence of a coupling capacitor. The headphone output impedance was a very high 805 ohms across the band. This output will work best with high-impedance headphones, like Sennheisers. (The manual does warn against using low-impedance headphones with the SV-737.)
The Vincent amplifier's output impedance at the loudspeaker terminals was a low 0.09 ohm at 20Hz and 1kHz, rising to 0.18 ohm at 20kHz. (These figures include the series impedance of 6' of spaced-pair loudspeaker cable.) The modulation of the amplifier's frequency response due to the Ohm's law interaction between this source impedance and the impedance of my standard simulated loudspeaker was therefore minimal (fig.1, gray trace). The response into an 8 ohm resistive load (fig.1, blue and red traces) was down by 3dB just above 100kHz, which correlates with the Vincent's accurate reproduction of a 10kHz squarewave into that load (fig.2). Fig.1 was taken with the volume control set to its maximum; neither the frequency response nor the excellent channel matching changed at lower settings of the volume control. The response at the preamplifier and headphone outputs was identical to that from the speaker outputs. The Treble control offered close to 8dB boost and cut in the high treble; the Bass control offered 11dB boost or cut in the midbass and below (fig.3).


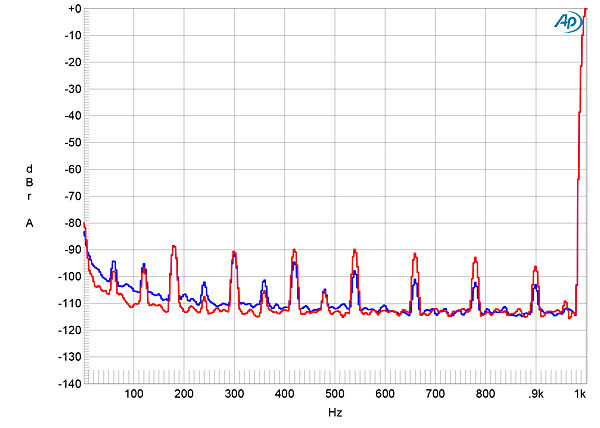
 Channel separation was good, at >80dB, R–L, and >90dB, L–R, below 2kHz, but closer to 60dB at the top of the audioband. The Vincent's unweighted, wideband signal/noise ratio, taken with the unbalanced line inputs shorted to ground but the volume control set to its maximum, was okay, at 67.5dB ref. 2.83V into 8 ohms (average of both channels). This ratio improved to 77dB when the measurement bandwidth was restricted to the audioband, and to 80dB when A-weighted. The background noise included spuriae at 60Hz and its even- and odd-order harmonics (fig.4), but these are all relatively low in level.


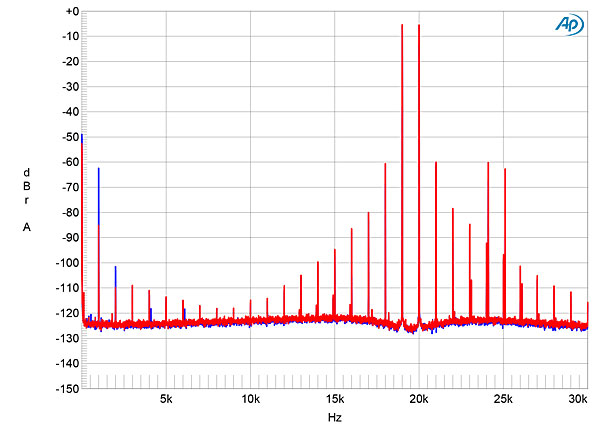
 When the SV-737 drove an equal mix of 19 and 20kHz tones at 100W peak into 4 ohms, very few intermodulation products were present, but as expected these are higher in the left channel (fig.12, blue trace) than the right (red). While the difference product at 1kHz lay at –66dB (0.05%) in the left channel compared with –90dB (0.003%) in the right channel, this is still relatively low in level.
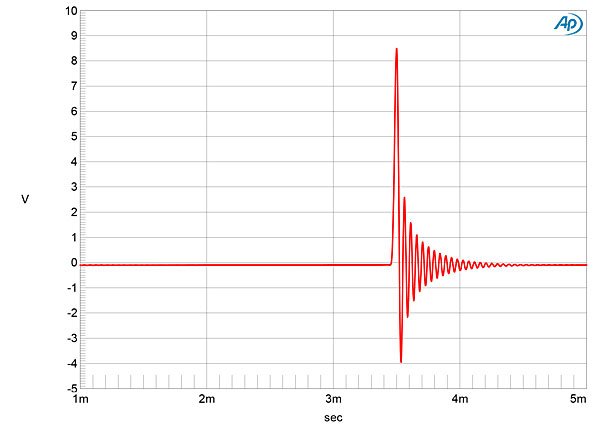
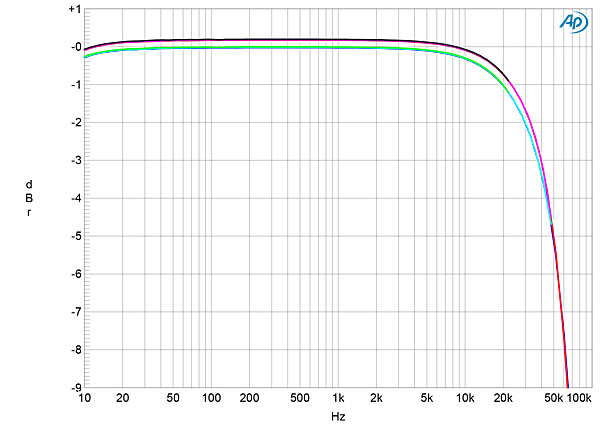
 The digital inputs' impulse response with 44.1kHz data (fig.13) indicates that the reconstruction filter is a minimum-phase type, with all the ringing following the single sample at 0dBFS. With 44.1kHz-sampled white noise (fig.14, red and magenta traces), the SV-737's response rolled off above 20kHz but had not reached full stop-band suppression at half the sample rate (vertical green line), and there is some unusual scalloping of the ultrasonic noise floor. An aliased image at 25kHz of a full-scale tone at 19.1kHz (blue and cyan traces) lies at –55dBFS, and the distortion harmonics of the 19.1kHz tone are higher in the left channel (cyan trace) than the right (blue trace). This confirms that the left channel's distortion is occurring in the Vincent's preamplifier stage. The SV-737's digital-input frequency response was flat in the audioband and follows the same basic shape at all sample rates up to 192kHz, with then a sharp rolloff just below half of each sample rate (fig.15).


 Assuming that the left channel's disappointing linearity was indeed due to an out-of-spec tube in the preamplifier stage, which will be specific to this sample, Vincent's SV-737 offers relatively high power with low harmonic and intermodulation distortion. The digital inputs and headphone output, however, should be regarded as more for convenience than for absolute performance.—John Atkinson
Footnote 1: I wasn't able to test the performance with the Bluetooth input.
Fig.1 Vincent SV-737, volume control set to maximum, frequency response at 2.83V into: simulated loudspeaker load (gray), 8 ohms (left channel blue, right red) 4 ohms (left cyan, right magenta), and 2 ohms (green) (0.5dB/vertical div.).
Fig.2 Vincent SV-737, small-signal 10kHz squarewave into 8 ohms.
Fig.3 Vincent SV-737, frequency response at 2.83V into 8 ohms with treble and bass controls set to their maximum and minimum and switched out of circuit (left channel blue, right red, 2.5dB/vertical div.).
Fig.4 Vincent SV-737, spectrum of 1kHz sinewave, DC–1kHz, at 1W into 8 ohms, volume control set to maximum (left channel cyan, right magenta; linear frequency scale).
The SV-737's nominal power is specified at 180Wpc into 8 ohms (22.55dBW) and 300Wpc into 4 ohms (21.8dBW). With clipping defined as the point at which the THD+noise reaches 1%, the SV-737 clipped with both channels driven at 155Wpc into 8 ohms (21.9dBW, fig.5). However, the relatively high level of distortion at lower powers puzzled me. Fig.5 was taken with the left channel; I repeated the test with the right channel. The result is shown in fig.6. While the clipping power into 8 ohms is still 155W, the distortion at lower powers is significantly lower than it had been in the left channel. Fig.7 shows that the right channel clipped at 240W into 4 ohms (20.8dBW). Though this is again lower than the specified power, I don't hold the wall voltage constant during the testing; it had dropped to 117V with the amplifier clipping.
Fig.5 Vincent SV-737, left channel. distortion (%) vs 1kHz continuous output power into 8 ohms.
Fig.6 Vincent SV-737, right channel, distortion (%) vs 1kHz continuous output power into 8 ohms.
Fig.7 Vincent SV-737, right channel, distortion (%) vs 1kHz continuous output power into 4 ohms.
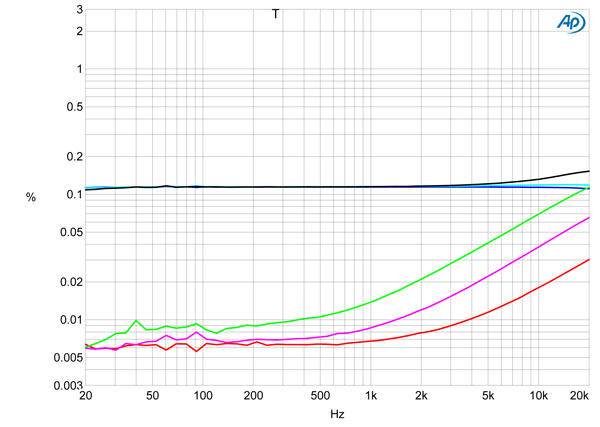
I examined how the THD+N percentage changed with frequency at 20V, which is equivalent to 50W into 8 ohms, 100W into 4 ohms, and 200W into 2 ohms. Though the right channel's distortion was very low in the bass and midrange into both 8 ohm and 4 ohm loads (fig.8, red and magenta traces), and rose only slightly into 2 ohms (green trace), the left channel's distortion was close to 0.1% into all three impedances (blue, cyan, and gray traces). The distortion was predominantly the subjectively benign second harmonic (fig.9) but was very much higher in the left channel (fig.10, blue trace) than the right (red trace).
Fig.8 Vincent SV-737, THD+N (%) vs frequency at 20V into: 8 ohms (left channel blue, right red), 4 ohms (left cyan, right magenta). 2 ohms (left gray, right green).
Fig.9 Vincent SV-737, left channel, 1kHz waveform at 50W into 8 ohms, 0.095% THD+N (top); distortion and noise waveform with fundamental notched out (bottom, not to scale).
Fig.10 Vincent SV-737, spectrum of 50Hz sinewave, DC–1kHz, at 50W into 8 ohms (left channel blue, right red; linear frequency scale).
As the Vincent's preamplifier and power amplifier sections can be operated independently, I repeated the spectral analysis shown in fig.10 by driving the power amplifier directly. The result is shown in fig.11. Though the left channel still has higher distortion than the right, the distortion is now very low in both channels. The left channel's much higher distortion in figs.5 and 8 must therefore be generated in the preamplifier circuit. It is possible that one of the small-signal tubes in the review sample was not performing to specification, but it is fair to point out that 0.1% of second-harmonic distortion is exceedingly difficult, perhaps even impossible, to hear with music.
Fig.11 Vincent SV-737, power amplifier input, spectrum of 50Hz sinewave, DC–1kHz, at 50W into 8 ohms (left channel blue, right red; linear frequency scale).
Fig.12 Vincent SV-737, HF intermodulation spectrum, DC–30kHz, 19+20kHz at 100W peak into 4 ohms (left channel blue, right red; linear frequency scale).
The Vincent SV-737's optical and coaxial S/PDIF digital inputs locked to data sampled up to 192kHz (footnote 1) and preserved absolute polarity at the preamplifier and headphone outputs, but polarity was inverted at the loudspeaker outputs. With the volume control set to its maximum, a 1kHz digital signal at –12dBFS resulted in a level at the loudspeaker outputs of 35.6V, which is equivalent to 158.4W into 8 ohms. This is just above the clipping power into this impedance, and the waveform on the oscilloscope screen was visibly squared off. The level at the headphone output with a 1kHz signal at –12dBFS was 36.87V, and at the preamplifier output it was 1.88V. As often appears to be the case with contemporary integrated amplifiers, the SV-737's digital inputs appear to have around 13dB of excess gain. To avoid damaging the Vincent's power amplifier stage with high-level digital signals, I performed all the measurements of the digital inputs' performance at the preamplifier output and with the volume control set to –12dB.
Fig.13 Vincent SV-737, digital input, impulse response (one sample at 0dBFS, 44.1kHz sampling, 4ms time window).
Fig.14 Vincent SV-737, digital input, wideband spectrum of white noise at –4dBFS (left channel red, right magenta) and 19.1kHz tone at 0dBFS (left blue, right cyan), with data sampled at 44.1kHz (20dB/vertical div.).
Fig.15 Vincent SV-737, digital input, frequency response at –12dBFS into 100k ohms with data sampled at: 44.1kHz (left channel green, right gray), 96kHz (left channel cyan, right magenta), 192kHz (left blue, right red) (1dB/vertical div.).
When I increased the bit depth from 16 to 24 with a dithered 1kHz tone at –90dBFS (fig.16), the noise floor components dropped by around 12dB, which implies that the SV-737's digital inputs offer 18 bits' worth of resolution. With undithered data representing a tone at exactly –90.31dBFS (fig.17), the three DC voltage levels described by the data were well resolved. With undithered 24-bit data (fig.18), the result was a somewhat noisy sinewave.
Fig.16 Vincent SV-737, digital input, spectrum with noise and spuriae of dithered 1kHz tone at –90dBFS with: 16-bit data (left channel cyan, right magenta), 24-bit data (left blue, right red) (20dB/vertical div.).
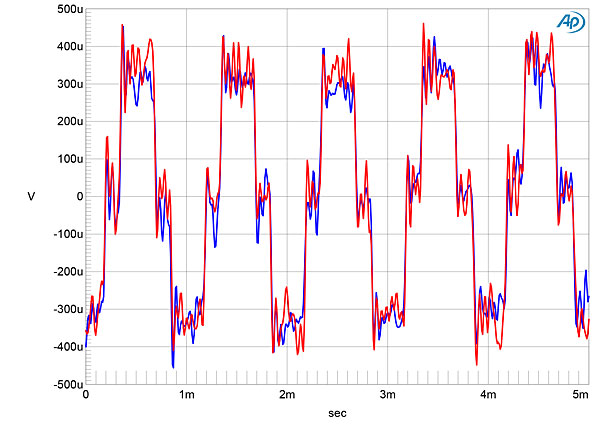
Fig.17 Vincent SV-737, digital input, waveform of undithered 1kHz sinewave at –90.31dBFS, 16-bit data (left channel blue, right red).
Fig.18 Vincent SV-737, digital input, waveform of undithered 1kHz sinewave at –90.31dBFS, 24-bit data (left channel blue, right red).
Intermodulation distortion via the Vincent amplifier's digital inputs was a little higher than it had been for analog input signals (fig.19), with some aliased images visible. I tested the SV-737 for its rejection of word-clock jitter via both its TosLink and coaxial S/PDIF inputs. The odd-order harmonics of the 16-bit J-Test signal's LSB-level, low-frequency squarewave were mostly obscured by the analog noise floor, but where they are visible, they are higher than the correct levels (fig.20, sloping green line). With 24-bit J-Test data (fig.21), jitter-related sidebands were present at ±229Hz.
Fig.19 Vincent SV-737, digital input, HF intermodulation spectrum, DC–30kHz, 19+20kHz at 0dBFS into 100k ohms (left channel red; linear frequency scale).
Fig.20 Vincent SV-737, digital input, high-resolution jitter spectrum of analog output signal, 11.025kHz at –6dBFS, sampled at 44.1kHz with LSB toggled at 229Hz: 16-bit Toslink data (left channel blue, right red). Center frequency of trace, 11.025kHz; frequency range, ±3.5kHz.
Fig.21 Vincent SV-737, digital input, high-resolution jitter spectrum of analog output signal, 11.025kHz at –6dBFS, sampled at 44.1kHz with LSB toggled at 229Hz: 24-bit Toslink data (left channel blue, right red). Center frequency of trace, 11.025kHz; frequency range, ±3.5kHz.
Footnote 1: I wasn't able to test the performance with the Bluetooth input.