Sidebar 3: Measurements
I used DRA Labs' MLSSA system and a calibrated DPA 4006 microphone to measure the Wharfedale Linton Heritage's frequency response in the farfield and an Earthworks QTC-40 mike for the nearfield responses. I usually leave a loudspeaker's grille off for the measurements. However, as the Linton's front baffle is set into the enclosure and the grille frame provides some acoustic profiling around the drive-units, I left the grille in place for most of the measurements. Interestingly, the labels on the boxes suggested that the speakers being reviewed were the exact same samples that had impressed me at the 2019 AXPONA last April.
Wharfedale specifies the Linton's sensitivity as 90dB at 1m for 2.0V input rather than 2.83V, the latter equivalent to 1W with an 8 ohm speaker. My estimate with the usual 2.83V was lower, at 88.1dB(B)/m, though this is a little higher than the average of all the loudspeakers I have measured. The impedance is specified as 6 ohms; the solid trace in fig.1 shows that the Linton's impedance is close to 6 ohms for much of the audioband. However, the minimum magnitude is 3.4 ohms at 130Hz, and there is a demanding combination of 5 ohms magnitude and –46° electrical phase angle (dotted trace) at 83Hz. The Wharfedale will work best with amplifiers that are comfortable driving 4 ohms.


 The black trace below 300Hz in fig.3 shows the sum of the nearfield woofer and port outputs, taking into account acoustic phase and the different distance of each radiator from a nominal farfield microphone position. The rise in response in the upper bass is due in part to the nearfield measurement technique. However, this graph does suggest that the port tuning is somewhat underdamped.
The Wharfedale's farfield response, averaged across a 30° horizontal window centered on the tweeter axis, is shown as the black trace above 300Hz. It is superbly flat and even up to 15kHz, above which the tweeter's output rapidly rolls off. This graph was taken with the grille in place. The response without the grille is very similar, but with the small suckout at the top of the midrange unit's passband slightly accentuated and a small peak introduced between 5 and 8kHz.
The Wharfedale's tweeter is positioned slightly closer to one side of the baffle than the other. I plotted the horizontal dispersion with the behavior off-axis on the tweeter side to the front in fig.4. With the relatively wide baffle, it is not surprising that the Linton becomes increasingly directional above 8kHz. There is also a slight flare off-axis at the bottom of the tweeter's passband, though this might be balanced in-room by the slightly dish-shaped on-axis response in the same region. In the vertical plane (fig.5), a suckout develops in the crossover region 10° below the tweeter axis, suggesting that the crossover and drive-unit polarities have been optimized for listening axes on and above the tweeter axis, which is around 36" from the floor with the speakers sitting on their dedicated stands.
The black trace below 300Hz in fig.3 shows the sum of the nearfield woofer and port outputs, taking into account acoustic phase and the different distance of each radiator from a nominal farfield microphone position. The rise in response in the upper bass is due in part to the nearfield measurement technique. However, this graph does suggest that the port tuning is somewhat underdamped.
The Wharfedale's farfield response, averaged across a 30° horizontal window centered on the tweeter axis, is shown as the black trace above 300Hz. It is superbly flat and even up to 15kHz, above which the tweeter's output rapidly rolls off. This graph was taken with the grille in place. The response without the grille is very similar, but with the small suckout at the top of the midrange unit's passband slightly accentuated and a small peak introduced between 5 and 8kHz.
The Wharfedale's tweeter is positioned slightly closer to one side of the baffle than the other. I plotted the horizontal dispersion with the behavior off-axis on the tweeter side to the front in fig.4. With the relatively wide baffle, it is not surprising that the Linton becomes increasingly directional above 8kHz. There is also a slight flare off-axis at the bottom of the tweeter's passband, though this might be balanced in-room by the slightly dish-shaped on-axis response in the same region. In the vertical plane (fig.5), a suckout develops in the crossover region 10° below the tweeter axis, suggesting that the crossover and drive-unit polarities have been optimized for listening axes on and above the tweeter axis, which is around 36" from the floor with the speakers sitting on their dedicated stands.


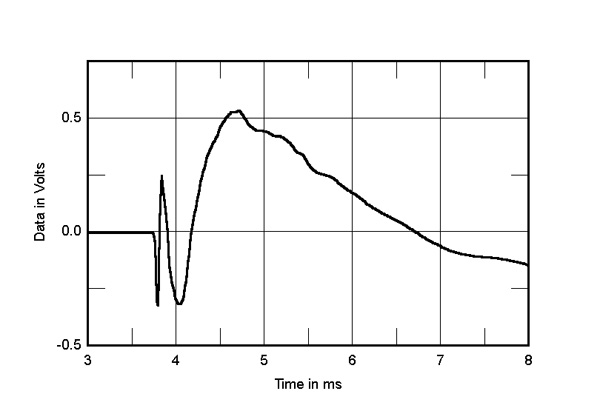

Fig.1 Wharfedale Linton, electrical impedance (solid) and phase (dashed) (2 ohms/vertical div.).
A small discontinuity just below 300Hz in the impedance traces suggests some sort of resonance in that region. When I investigated the enclosure's vibrational behavior with a plastic-tape accelerometer, I found a pair of strong, high-Q modes at 281Hz and 300Hz on the sidewalls (fig.2). The 281Hz mode was also present on the top and rear panels, and there was also a strong mode at 660Hz on the rear panel. The lower-frequency modes are high enough in level that I would have thought they would lead to some midrange congestion.
Fig.2 Wharfedale Linton, cumulative spectral-decay plot calculated from output of accelerometer fastened to center of sidewall (MLS driving voltage to speaker, 7.55V; measurement bandwidth, 2kHz).
The impedance-magnitude plot has a saddle centered on 39Hz, which implies that this is the tuning frequency of the two flared ports on the Linton's rear panel. The blue trace in fig.3 shows the woofer's nearfield response, which has a minimum-motion notch at 41Hz. (This is the frequency at which the back pressure from the port resonance holds the cone stationary.) The nearfield response of the ports (red trace) peaks at the same frequency, and though its upper-frequency rolloff is disturbed by a broad peak around 200Hz, this is well down in level.
Fig.3 Wharfedale Linton, anechoic response on tweeter axis at 50", averaged across 30° horizontal window and corrected for microphone response, with nearfield woofer (blue) and port (red) responses and their complex sum respectively plotted below 300Hz, 480Hz, and 300Hz.
Fig.4 Wharfedale Linton, lateral response family at 50", normalized to response on tweeter axis, from back to front: differences in response 90–5° off axis on tweeter side of the baffle, reference response, differences in response 5–90° off axis on the other side of the baffle.
Fig.5 Wharfedale Linton, vertical response family at 50", normalized to response on tweeter axis, from back to front: differences in response 15–5° above axis, reference response, differences in response 5–15° below axis.
In the time domain, the Linton's step response (fig.6) indicates that the tweeter and midrange unit are connected in negative acoustic polarity, the woofer in positive polarity. (I checked this by looking at the nearfield step responses of the two lower-frequency units.) The decay of the tweeter's step smoothly blends with the start of the midrange unit's step, the decay of which smoothly blends with the start of the woofer's step. This reinforces the optimal crossover implementation seen in fig.3.
Fig.6 Wharfedale Linton, step response on tweeter axis at 50" (5ms time window, 30kHz bandwidth).
The Wharfedale's cumulative spectral decay plot (fig.7), taken with the grille removed, is relatively clean overall, though some low-level delayed energy can be seen in the low- and mid-treble regions. (As always with these plots, ignore the black ridge at exactly 15.75kHz, which is due to interference from the MLSSA host PC's video circuitry.)
Fig.7 Wharfedale Linton, cumulative spectral-decay plot on tweeter axis at 50" (0.15ms risetime).
Overall, the Wharfedale Linton Heritage offers excellent measured performance, though that under-damped bass alignment might mean extra care having to be taken in room placement.—John Atkinson


