Sidebar 3: Measurements
I used DRA Labs' MLSSA system and a calibrated DPA 4006 microphone to measure the Wilson Alexia 2's frequency response in the farfield, and an Earthworks QTC-40 for the nearfield and spatially averaged room responses. Because of the speaker's weight, I was unable to raise it off the ground for the measurements, which reduced the resolution of the frequency-response graphs in the midrange. And as with the original Alexia, there was the problem of which axis to place the microphone on for the farfield measurements. I wanted to measure it at my standard 50" microphone distance, which is optimal for midrange resolution in the resultant graphs, even with the speaker sitting on the floor. So I drew a line from the tweeter to the position and 36" height of my ears, 128" away—the original Alexias had been closer, 106"—then moved the mike up along that line until it was 50" from the tweeter. Other than those used to assess the Alexia's vertical dispersion, all the farfield measurements were taken at that point.
My estimate of the Alexia 2's voltage sensitivity was a very high 91.2dB(B)/2.83V/m, which is higher than specified. This speaker will play loudly with just a few volts. However, while it is not quite as difficult a load as the original Alexia, which had a minimum impedance of 1.96 ohms at 86Hz and a combination of 3.6 ohms and –43° phase angle at 54Hz, the Alexia 2 is still a current-hungry design. Its impedance drops to 2.6 ohms at 84Hz (fig.1), and there is a demanding combination of 5.1 ohms and –44° electrical phase angle at 57Hz, both frequencies in regions where music can have high energy levels.
 The green trace in fig.2 shows the output of the midrange unit, measured in the nearfield. It appears to cross over to the sum of the woofer outputs (blue trace; these have almost identical responses) at around 200Hz. The sharply defined null at 23Hz in the woofers' nearfield response suggests that this is the tuning frequency of the large rear-facing port. The port's output (red trace) peaks broadly between 10 and 60Hz, and its upper-frequency rolloff is free from any resonance spikes.
 The plot of the Alexia 2's lateral dispersion (fig.3) reveals that the tweeter becomes very directional above 12kHz, which might well make the speaker sound a bit lacking in top-octave air in large or overdamped rooms. The apparent off-axis peak between 4 and 5kHz in this graph is due to the on-axis suckout visible in fig.2 filling in to the speaker's sides. Overall, as with the original speaker, the Alexia 2's off-axis behavior is well controlled and even. In the vertical plane (fig.4), a suckout develops at the upper crossover frequency more than 10° above the listening axis, but the speaker's balance doesn't change by much over a ±5° window centered on the listening axis.

 Fig.5 compares the spatially averaged response in my room of the new Alexias (red trace) with that of the originals fitted with the revised tweeter resistors (blue). (The traces were generated by averaging 20 1/6-octave–smoothed spectra, taken for the left and right speakers individually using SMUGSoftware's FuzzMeasure 3.0 program and a 96kHz sample rate, in a vertical rectangular grid 36" wide by 18" high and centered on the positions of my ears.) The two speakers again look to be very similar, but you can see that the older Alexias had more presence-region energy and a reduced top-octave output. The new speakers had a little less midbass energy, but excited the lowest-frequency mode in my room a bit more.

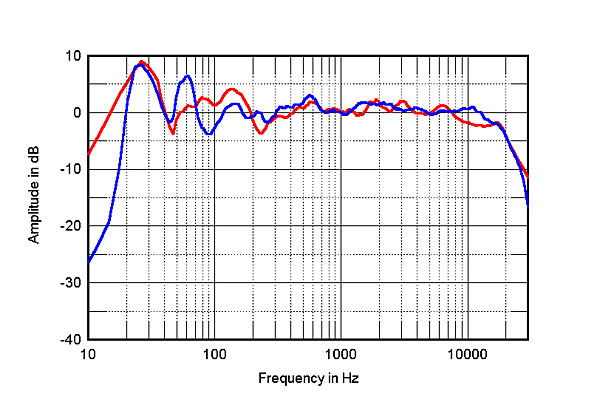
 Fig.7 Wilson Alexia 2, step response on listening axis at 50" (5ms time window, 30kHz bandwidth).
The cumulative spectral-decay plot on this axis (fig.8) was very similar to that of the original Alexia. While looking not as clean as I expected from what I heard, it doesn't have the significant resonances at 3 and 6.4kHz that Keith Howard found in his measurements of the Alexia 2 published in the March 2018 issue of our sister magazine Hi-Fi News.
Fig.7 Wilson Alexia 2, step response on listening axis at 50" (5ms time window, 30kHz bandwidth).
The cumulative spectral-decay plot on this axis (fig.8) was very similar to that of the original Alexia. While looking not as clean as I expected from what I heard, it doesn't have the significant resonances at 3 and 6.4kHz that Keith Howard found in his measurements of the Alexia 2 published in the March 2018 issue of our sister magazine Hi-Fi News.

Fig.1 Wilson Alexia 2, electrical impedance (solid) and phase (dashed) (2 ohms/vertical div.).
The traces in fig.1 are free from the small wrinkles that would imply the presence of cabinet-wall resonances, and the enclosures were acoustically quiet. I found modes on the woofer enclosure walls just below 400 and 600Hz, but these were low in level. The midrange subenclosure was a little livelier, with two high-Q modes on the sidewalls and rear panel, at 590 and 870Hz. These were relatively low in level, however, and high enough in frequency that, given their high Q, they shouldn't be fully excited with music (as opposed to test tones). Peculiarly, the small module housing the tweeter was the liveliest; fortunately, this module is small enough that it won't couple this behavior to the air very efficiently.
Fig.2 Wilson Alexia 2, anechoic response on listening axis at 50", averaged across 30° horizontal window and corrected for microphone response, with nearfield responses of: midrange unit (green), woofers (blue), port (red), respectively plotted below 350Hz, 1kHz, 300Hz, and complex sum of nearfield responses plotted below 300Hz (black).
Higher in frequency in fig.2, the black trace below 300Hz shows the complex sum of the nearfield drive-unit outputs, taking into account both amplitude and phase. The broad peak in the midbass will be mostly due to the nearfield measurement technique, which assumes that the drive-units are mounted in a baffle that extends to infinity in both planes. Above 300Hz, the response, averaged across a 30° horizontal window centered on the listening axis, is very similar to that of the original Alexia, with small peaks throughout the upper midrange and treble balanced by small dips. However, while the new speaker, like the old, has a small suckout between 4 and 5kHz—which, I conjectured in my December 2013 review, was due to destructive interference between the tweeter's direct output and the reflections from the midrange enclosure—the Alexia 2 has about 2dB more energy above 6kHz than the older speaker. The two speakers' farfield responses matched very closely, any difference being 0.5dB or less throughout the treble.
Fig.3 Wilson Alexia 2, lateral response family at 50", normalized to response on listening axis, from back to front: differences in response 90–5° off axis, reference response, differences in response 5–90° off axis.
Fig.4 Wilson Alexia 2, vertical response family at 50", normalized to response on listening axis, from back to front: differences in response 15–5° above axis, reference response, differences in response 5–10° below axis.
Fig.5 Wilson Alexia 2, spatially averaged, 1/6-octave response in JA's listening room (red); and of Wilson Alexia (blue).
The full-range, floorstanding speaker I most recently reviewed was GoldenEar Technology's Triton Reference, in January 2018. The Triton's in-room response, measured in the identical manner, is shown in fig.6 (blue trace). Above 300Hz, where the spatial averaging has minimized the influence of low-frequency room resonances, it is very close to that of the Alexia 2 (red trace), though with slightly more energy, both in the high treble between 8 and 16kHz, and in the midrange. Both speakers excite the lowest-frequency room mode to the same degree, but the GoldenEar also has a peak at the tuning frequency of its passive radiators. The Wilson has a greater output in the upper bass.
Fig.6 Wilson Alexia 2, spatially averaged, 1/6-octave response in JA's listening room (red); and of GoldenEar Technology Triton Reference (blue).
Turning to the time domain, the Alexia2's step response on its listening axis is shown in fig.7; it reveals that the tweeter is connected in positive acoustic polarity, the midrange driver in negative polarity, and both woofers in positive polarity (confirmed by their nearfield step responses, not shown). The slight discontinuity at 4ms suggests that the woofers' output would be better integrated with that of the midrange slightly below the axis on which I took the measurement. However, this would disturb the excellent integration of the midrange unit's and tweeter's outputs.
Fig.7 Wilson Alexia 2, step response on listening axis at 50" (5ms time window, 30kHz bandwidth).
The cumulative spectral-decay plot on this axis (fig.8) was very similar to that of the original Alexia. While looking not as clean as I expected from what I heard, it doesn't have the significant resonances at 3 and 6.4kHz that Keith Howard found in his measurements of the Alexia 2 published in the March 2018 issue of our sister magazine Hi-Fi News.
Fig.8 Wilson Alexia 2, cumulative spectral-decay plot on listening axis at 50" (0.15ms risetime).
Like its predecessor's, the Alexia 2's measured performance reveals some idiosyncrasies; but overall, there is nothing to contradict the very positive results of my auditioning.—John Atkinson


