Sidebar 3: Measurements
I used DRA Labs' MLSSA system and a calibrated DPA 4006 microphone to measure the Bowers & Wilkins 705 S3's behavior in the farfield, and an Earthworks QTC-40 mike for the nearfield responses. I left off the grille that covers the woofer for the measurements.


Footnote 1: EPDR is the resistive load that gives rise to the same peak dissipation in an amplifier's output devices as the loudspeaker. See "Audio Power Amplifiers for Loudspeaker Loads," JAES, Vol.42 No.9, September 1994, and stereophile.com/reference/707heavy/index.html.
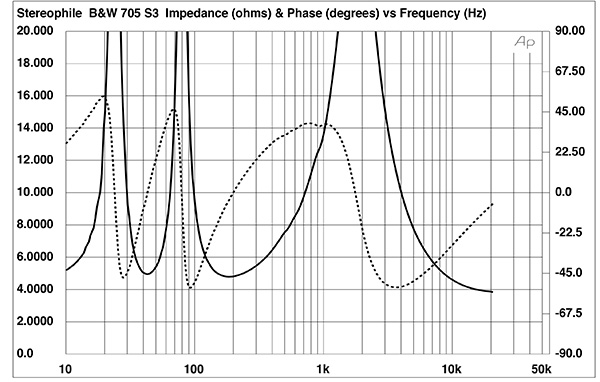
Fig.1 Bowers & Wilkins 705 S3, electrical impedance (solid) and phase (dashed) (2 ohms/vertical div.).
B&W specifies the 705 S3's sensitivity as 88dB/2.83V/m. My B-weighted estimate was a little higher, at 88.9dB(B)/2.83V/m. The 705 S3's nominal impedance is specified as 8 ohms, with a minimum value of 3.7 ohms. The speaker's impedance magnitude (fig.1, solid trace) remains above 5 ohms for almost the entire audioband, dropping below 4 ohms above 15kHz. The electrical phase angle (dotted trace) is occasionally high, as a result of which the equivalent peak dissipation resistance, or EPDR (footnote 1), lies below 3 ohms in the bass and lower midrange, and below 2 ohms in the top two octaves. The minimum EPDR values are 2.63 ohms at 56Hz, 2.33 ohms at 117Hz, and 1.92 ohms at 8.6kHz. The 705 S3 needs to be paired with amplifiers that don't have problems driving low impedances.
Fig.2 Bowers & Wilkins 705 S3, cumulative spectral-decay plot calculated from output of accelerometer fastened to center of sidewall (measurement bandwidth, 2kHz).
The impedance traces are free from the small discontinuities in the midrange that would imply the existence of resonances of various kinds. When I investigated the enclosure's side and top panels' vibrational behavior with a plastic-tape accelerometer, I found a strong resonant mode at 617Hz on the speaker's sides (fig.2). As this mode is relatively high in frequency and has a high Q (Quality Factor), it may have no audible consequences.
Fig.3 Bowers & Wilkins 705 S3, acoustic crossover on tweeter axis at 50", corrected for microphone response, with the nearfield woofer (green) and port (red) responses respectively plotted below 500Hz and 900Hz.
The Bowers & Wilkins speaker's impedance-magnitude plot has a saddle in the bass centered on 45Hz, which suggests that this is the tuning frequency of the flared port on the rear panel. (Fig.1 was taken with the port open; with the port blocked with the supplied foam plug, the impedance has a single peak at 69Hz.) The woofer's nearfield response (fig.3, green trace) has the expected reflex notch at this frequency, and the port's output (fig.3, red trace) peaks between 30Hz and 80Hz. The port's upper-frequency rolloff is initially clean, though some significant resonant peaks are present between 400Hz and 800Hz. This behavior may well be ameliorated by the fact that the port faces away from the listener. The complex sum of the woofer and port responses is shown as the black trace below 300Hz in fig.4. The apparent boost in the upper bass is mostly an artifact of the nearfield measurement technique, which assumes that the baffle extends to infinity in both planes. The 705 S3's reflex alignment appears to be maximally flat, in textbook fashion.
Fig.4 Bowers & Wilkins 705 S3, anechoic response on tweeter axis at 50", averaged across 30° horizontal window and corrected for microphone response, with the complex sum of the nearfield woofer and port responses plotted below 300Hz.
The woofer crosses over to the tweeter (fig.3, blue trace) at 3kHz, with shallow low-pass and high-pass filter slopes. The tweeter's on-axis output then rises precipitously, peaking by almost 10dB at 10kHz. (Both samples were identical in this respect.) The response then drops by the same amount before starting to rise again above 20kHz. I don't have a microphone that allows me to measure frequency responses above 40kHz; the tweeter's fundamental dome resonance appears to lie above that frequency. (Paul Miller, in Stereophile's sister magazine Hi-Fi News, found that the dome resonance of the similar tweeter in B&W's 703 S3 floorstander occurred at an extremely high 49kHz.)
Fig.5 Bowers & Wilkins 705 S3, lateral response family at 50", normalized to response on tweeter axis, from back to front: differences in response 90–5° off axis, reference response, differences in response 5–90° off axis.
Fig.6 Bowers & Wilkins 705 S3, vertical response family at 50", normalized to response on tweeter axis, from back to front: differences in response 45–5° above axis, reference response, differences in response 5–45° below axis.
The 705 S3's farfield output, averaged across a 30° horizontal window centered on the tweeter axis (fig.4, black trace above 300Hz), still has the rising response above 3kHz, despite the spatial averaging, due to the wide horizontal dispersion in this region (fig.5). Fig.5 does indicate that the top-octave output starts to fall off beyond 20° to the speaker's sides, so directing the speakers straight ahead instead of toeing them in toward the listening seat should reduce the audibility of the energy excess in this region. In the vertical plane (fig.6), a suckout appears in the crossover region 5° above and more than 10° below the tweeter axis. The speaker should be used on a sufficiently high stand to place the listener's ears on or just below the tweeter axis.
Fig.7 Bowers & Wilkins 705 S3, step response on tweeter axis at 50" (5ms time window, 30kHz bandwidth).
Fig.8 Bowers & Wilkins 705 S3, cumulative spectral-decay plot on tweeter axis at 50" (0.15ms risetime).
Moving to the time domain, fig.7 shows the 705 S3's step response on the tweeter axis. The tweeter's output arrives first at the microphone. The two drivers are connected in positive acoustic polarity. The small discontinuity at 3.9ms, which is when the decay of the tweeter's step blends with the start of the woofer's step, suggests that the outputs of the two drivers optimally blend just below the tweeter axis. The B&W speaker's cumulative spectral-decay plot (fig.8) is clean overall. (As always, ignore the apparent low-level ridge of delayed energy just below 16kHz, which is due to interference from the MLSSA host PC's video circuitry.)
The 705 S3's measured behavior is enigmatic. That response peak at 10kHz will not be heard as "brightness" as such. Instead, it will add "air," "transparency," and "openness" to the perceived balance. But it will make system matching tricky and may emphasize surface noise with vinyl playback.—John Atkinson
Footnote 1: EPDR is the resistive load that gives rise to the same peak dissipation in an amplifier's output devices as the loudspeaker. See "Audio Power Amplifiers for Loudspeaker Loads," JAES, Vol.42 No.9, September 1994, and stereophile.com/reference/707heavy/index.html.