Sidebar 3: Measurements
I performed a full set of measurements on the M28 (serial number 1006) using my Audio Precision SYS2722 system (see www.ap.com and the January 2008 "As We See It"). As the Bricasti amplifier is specified as having a maximum output power of 200W into 8 ohms, I preconditioned it before the measurements by running it at one-third that power, 67W, into 8 ohms for an hour, following which the top panel was warm, at 99.3°F (37.4°C), and the side panel covering the internal heatsink was only slightly hotter, at 106.7°F (41.5°C). The THD+noise percentage at this power level was 0.0017% with the amplifier cold, 0.002% with it fully warm.
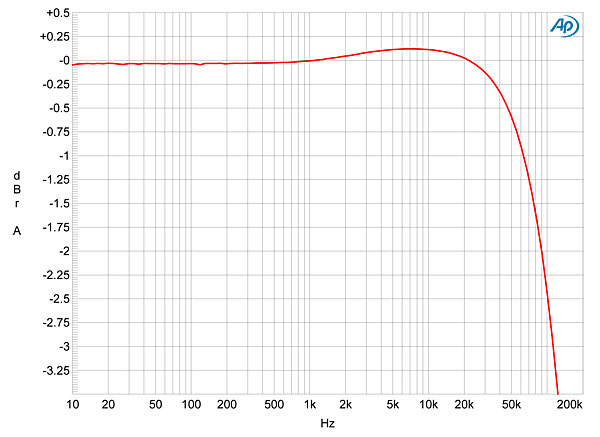
The voltage gain at 1kHz into 8 ohms was 26.9dB with a balanced input signal, 26.65dB with an unbalanced signal, and the amplifier preserved absolute polarity (ie, was non-inverting) for both inputs. The rear-panel level-trim control applied three attenuation steps, each of 6.1dB. The unbalanced input impedance was a usefully high 88k ohms at 20Hz and 1kHz, dropping slightly to 36k ohms at 20kHz. The balanced input impedances were twice these values, as expected. The output impedance, including 6' of speaker cable, was very low, at 0.05 ohm at low and middle frequencies, rising to 0.06 ohm at the top of the audioband. As a result, the variation in response due to the interaction between this source impedance and the impedance of our standard simulated loudspeaker (see www.stereophile.com/content/real-life-measurements-page-2) was just ±0.05dB (fig.1, gray trace). The response was perfectly flat in the audioband, and down by 3dB at 180kHz into 8 ohms (blue trace). As a result, the M28's reproduction of a 10kHz squarewave was essentially perfect, with no overshoot or ringing (fig.2). Fig.1 was taken with balanced drive; with unbalanced drive (fig.3), the response had a small, +0.18dB plateau in the treble, and the ultrasonic output rolled off a little earlier than with a balanced input signal.


 Its measured performance reveals Bricasti's M28 to be a worthy stablemate to the company's superb-measuring and equally superb-sounding M1 D/A processor.—John Atkinson
Fig.1 Bricasti M28, balanced frequency response at 2.83V into: simulated loudspeaker load (gray), 8 ohms (blue), 4 ohms (magenta), 2 ohms (red) (0.25dB/vertical div.).
Fig.2 Bricasti M28, small-signal 10kHz squarewave into 8 ohms.
Fig.3 Bricasti M28, unbalanced frequency response at 2.83V into 8 ohms (0.25dB/vertical div.).
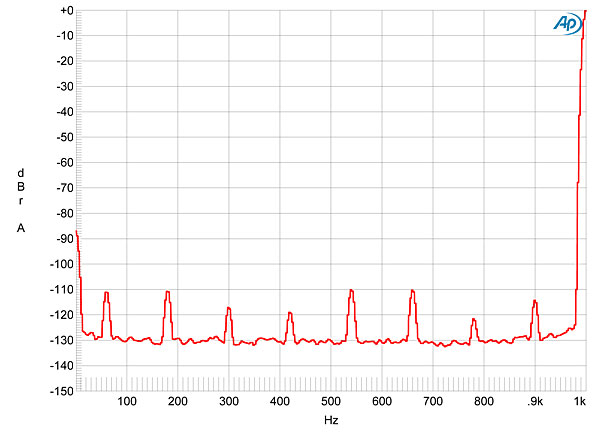
The Bricasti M28 is a very quiet amplifier. Its unweighted wideband signal/noise ratio, ref. 1W into 8 ohms with the input shorted, was 80.5dB, improving to 84.7dB when the measurement was restricted to the audioband, and to 85.7dB when A-weighted. Spectral analysis of the amplifier's low-frequency noise floor while it drove a 1kHz tone at 1W into 8 ohms (fig.4) revealed that the power-supply–related spuriae were 60Hz and its odd harmonics—generally due to magnetic interference from the power transformer—but even the highest in level lay at just –110dB (0.0003%).
Fig.4 Bricasti M28, spectrum of 1kHz sinewave, DC–1kHz, at 1W into 8 ohms (linear frequency scale).
Figs. 5 and 6 plot the percentage of THD+noise against output power into 8 and 4 ohms, respectively. With clipping defined as the point at which the THD+N reaches 1%, the M28 exceeded its specified power of 200W into 8 ohms (23dBW), clipping at 250W (24dBW). Into 4 ohms, the Bricasti amplifier clipped at 490W (23.9dBW). When I tested the clipping behavior into 2 ohms, the M28's protection circuit operated at 128W into that load (fig.7). Turning the amplifier off and on again restored normal operation.
Fig.5 Bricasti M28, distortion (%) vs 1kHz continuous output power into 8 ohms.
Fig.6 Bricasti M28, distortion (%) vs 1kHz continuous output power into 4 ohms.
Fig.7 Bricasti M28, distortion (%) vs 1kHz continuous output power into 2 ohms.
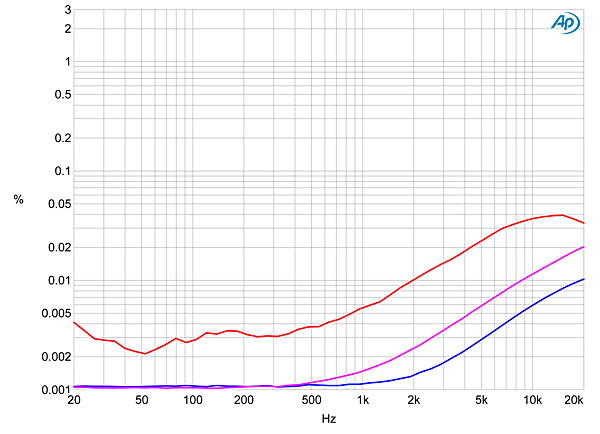
The downward slope of the traces below 10W or so in figs. 5 and 6 suggests that even with the low noise, the M28's actual distortion lies below that noise floor. Therefore, to be sure I was measuring actual distortion, I examined how the amplifier's THD+N percentage varied with frequency at 9V, which is equivalent to 10W into 8 ohms, 20W into 4 ohms, and 40W into 2 ohms. The results are shown in fig.8: the THD is superbly low at or below 1kHz, even into 2 ohms (red trace), but rises slightly in the treble, presumably due to the circuit's decreasing amount of gain-bandwidth margin reducing the amount of corrective negative feedback available. But even at 20kHz into 2 ohms, the THD+N is still just 0.04%.
Fig.8 Bricasti M28, THD+N (%) vs frequency at 9V into: 8 ohms (blue), 4 ohms (magenta), 2 ohms (red).
The distortion signature was predominantly third-harmonic in nature (fig.9), though fig.10 reveals that, even at 40% power into 4 ohms, this lay at –90dB (0.003%). Even with the slight rise in THD in the top octave, intermodulation distortion with an equal mix of 19 and 20kHz tones at a level a few dB below visible waveform clipping on the oscilloscope into 4 ohms was very low (fig.11). The difference component at 1kHz lay at just –112dB below the peak signal level (0.00025%), and the higher-order products at 18 and 21kHz were at –97dB (0.0014%).
Fig.9 Bricasti M28, 1kHz waveform at 75W into 8 ohms, 0.0019% THD+N (top); distortion and noise waveform with fundamental notched out (bottom, not to scale).
Fig.10 Bricasti M28, spectrum of 50Hz sinewave, DC–1kHz, at 200W into 4 ohms (linear frequency scale).
Fig.11 Bricasti M28, HF intermodulation spectrum, DC–24kHz, 19+20kHz at 200W peak into 4 ohms (linear frequency scale).