Sidebar 3: Measurements
I measured the Cary SLI-80HS using my Audio Precision SYS2722 system (see the January 2008 As We See It"). Both the small-signal and output tubes—all Electro-Harmonix—are numbered or marked L or R, and I installed them as instructed in the manual. Cary recommends checking the output stage bias current when the tubes are first installed and setting it to between 75mA and 85mA with the trim pots on the top panel. When the amplifier was first powered up, the left channel bias measured 79mA, the right 82mA. I checked the bias currents at intervals throughout the testing. They stabilized at 81mA and 82mA, respectively.
The Cary amplifier's maximum voltage gain varied with output transformer tap and output stage mode. In Ultralinear mode, the gain measured 32.65dB from the 8 ohm tap and 31.2dB from the 4 ohm tap. Gains in triode mode were 30.85dB and 29.1dB, respectively. These gains are all a little on the low side for an integrated amplifier. Gain at the headphone output was 11dB. The input impedance, specified at 100k ohms, was a still-high 63k ohms at low and middle frequencies but dropped to 35k ohms at the top of the audioband. The speaker and headphone outputs all preserved absolute polarityie, were noninverting.
The output impedance from the headphone output was close to 2.5 ohms across the audioband. The output impedance from the SLI-80HS's 8 ohm tap was fairly high in both Ultra-linear and triode modes, at 4.35 ohms, Ultralinear, and 3.2 ohms, triode, both values consistent from 20Hz to 20kHz. The 4 ohm tap offered a lower impedance: 2.27 ohms, Ultralinear, and 1.75 ohms, triode. As a result of the Ohm's law interaction between the high output impedances and the impedance of our standard simulated loudspeaker, the amplifier's frequency response into this load varied by an audible ±1.1dB from the 4 ohm tap, even in triode mode (fig.1, gray trace). The SLI-80HS offered a flat response in the audioband, but with the right channel (red and magenta traces) 0.4dB lower in level than the left (blue and cyan). Note also the peak above 100kHz, which is presumably due to the output transformer; this peak is increasingly suppressed as the load impedance dropped.
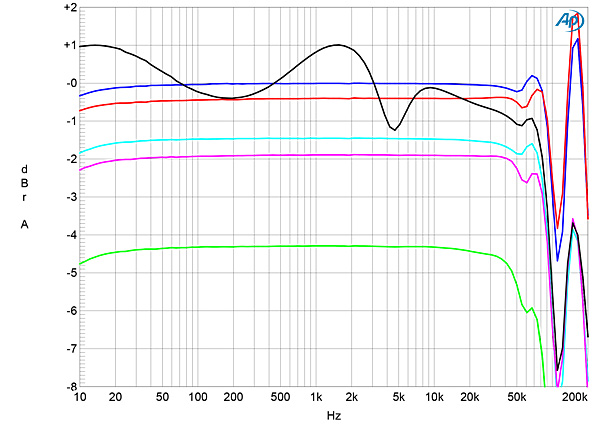

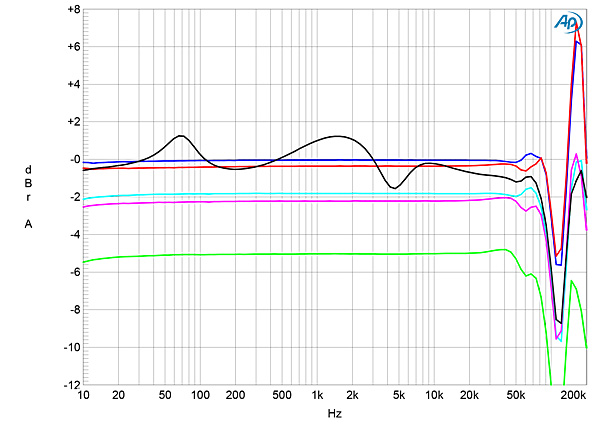
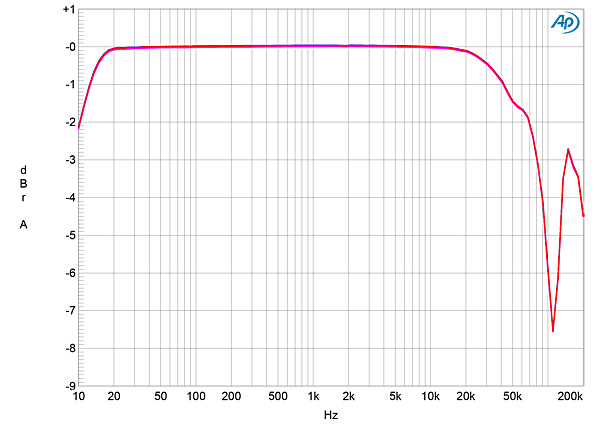

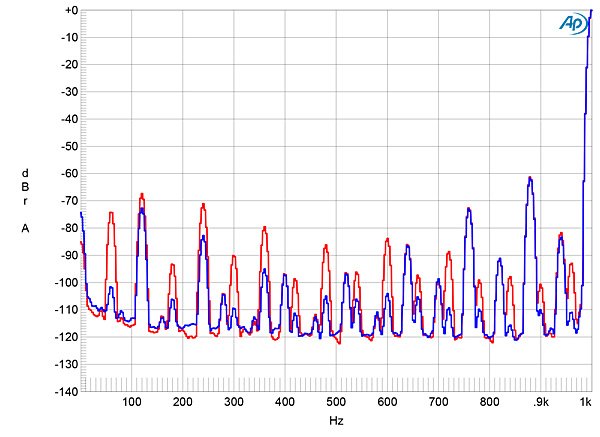


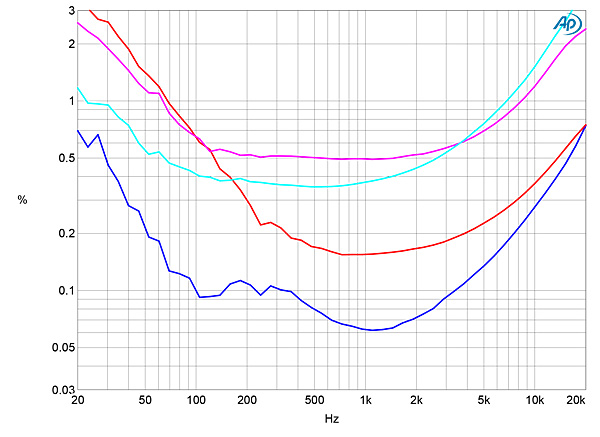
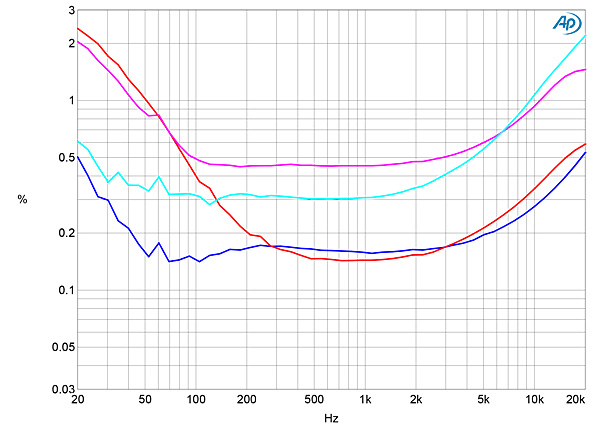
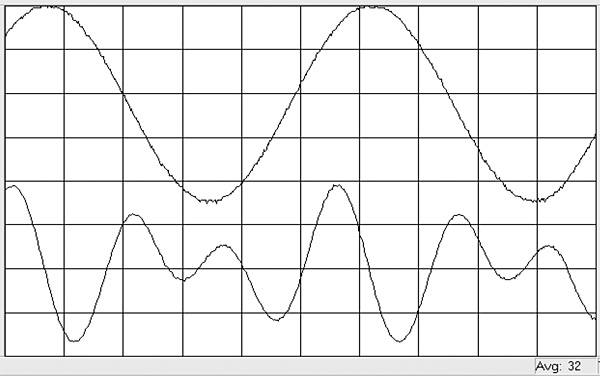


Fig.1 Cary SLI-80HS, Triode mode, 4 ohm tap, volume control max, frequency response at 2.83V into: simulated loudspeaker load (gray), 8 ohms (left channel blue, right red), 4 ohms (left cyan, right magenta), 2 ohms (green) (1dB/vertical div.).
Fig.1 was taken with the volume control set to its maximum. At lower settings of the volume control (fig.2), the ultrasonic peak was much less in evidence, though the channel imbalance remained. The peak was considerably higher in level in Ultralinear mode (fig.3) and was still present when I measured the response from the headphone output (fig.4), which suggests that the latter is taken from after the output transformer. With the ultrasonic peak accentuated from the Ultralinear mode, it came as no surprise that ringing could be seen with the SLI-80HS's reproduction of a 10kHz squarewave (fig.5). The waveform's risetimes are very short, however.
Fig.2 Cary SLI-80HS, Triode Mode, volume control 12:00, frequency response at 2.83V into 8 ohms from the 4 ohm tap (left channel blue, right red) and the 8 ohm tap (left cyan, right magenta) (1dB/vertical div.).
Fig.3 Cary SLI-80HS, Ultralinear mode, 4 ohm tap, volume control max, frequency response at 2.83V into: simulated loudspeaker load (gray), 8 ohms (left channel blue, right red), 4 ohms (left cyan, right magenta), 2 ohms (green) (1dB/vertical div.).
Fig.4 Cary SLI-80HS, headphone output, volume control max, frequency response at 1V into 100k ohms (left channel blue, right red) (1dB/vertical div.).
Fig.5 Cary SLI-80HS, Ultralinear mode, 8 ohm tap, small-signal 10kHz squarewave into 8 ohms.
Channel separation (not shown) was good, at >80dB below 2kHz and still 66dB at 20kHz. The unweighted, wideband signal/noise ratio, measured at the 8 ohm output tap in triode mode and taken with the input shorted, was good at 70.4dB ref. 1W into 8 ohms in left channel. It was much worse in the right channel, however, measuring 48.2dB. When A-weighted, these ratios respectively improved to 87.0 and 73.7dB. The ratios in Ultralinear mode were 1–3dB worse, and those from the 4 ohm tap were about 2dB better. The reason for the difference between the channels' ratios can be seen in fig.6, which shows the spectrum of the amplifier's output as it drove a 1kHz tone at 1W into 8ohms from the 8 ohm tap in triode mode. Power-supply–related spuriae at 60, 240, and 360Hz are much higher in the right channel (red trace) than the left (blue). In addition, the relatively high level of 120Hz-related spuriae suggests that there is a non-zero impedance to ground somewhere in the SLI-80HS's circuit.
Fig.6 Cary SLI-80HS, Triode mode, 8 ohm tap, spectrum of 1kHz sinewave, DC–1kHz, at 1W into 8 ohms (left channel blue, right red, linear frequency scale).
The Cary SLI-80HS is specified as having a maximum output power of 40Wpc into 8 ohms (16.02dBW) in triode mode or 80Wpc into 8 ohms (19.03dBW) in Ultralinear mode. Fig.7 was taken from the 8 ohm tap in triode mode into 8 ohms. The trace reaches the specified 40W at 3% THD+noise rather than the usual 1% THD+N, and the steady rise in the percentage above 1W suggests that the SLI80-HS's circuit features a modest amount of loop negative feedback. The graph with the 4 ohm tap driving 4 ohms was identical, with again the THD+N reaching 3% at 40W. As expected, less power was available from the 8 ohm tap into 4 ohms (not shown), but with the 4 ohm tap driving 8 ohms, while the maximum power is the same as from the 8 ohm tap, there was less distortion between 3W and 40W (fig.8).
Fig.7 Cary SLI-80HS, Triode mode, 8 ohm tap, THD+N (%) vs 1kHz continuous output power into 8 ohms.
Fig.8 Cary SLI-80HS, Triode mode, 4 ohm tap, THD+N (%) vs 1kHz continuous output power into 4 ohms.
In Ultralinear mode, the low-power distortion into 8 ohms was lower than it was in triode mode, both from the 8 ohm tap (fig.9) and from the 4 ohm tap (fig.10). However, in this mode the amplifier failed to reach its specified power, even at 3% THD+N. With a relaxed definition of clipping as being when the THD+N reached 3%, the SLI-80HS clipped at 33Wpc into 8 ohms from the 8 ohm tap (15.2dBW) and at 60Wpc into 8 ohms from the 4 ohm tap (17.8dBW).
Fig.9 Cary SLI-80HS, Ultralinear mode, 8 ohm tap, THD+N (%) vs 1kHz continuous output power into 8 ohms.
Fig.10 Cary SLI-80HS, Ultralinear mode, 4 ohm tap, THD+N (%) vs 1kHz continuous output power into 4 ohms.
The Cary's channels differed in their linearity. Fig.11 plots the THD+N percentage against frequency from the 4 ohm tap in Ultralinear mode at 6.33V into 8 and 4 ohms. The right channel (red and magenta traces) offered higher distortion than the left (blue, cyan), particularly at low frequencies, which suggests that that channel's output transformer is not as good as the left channel's. This behavior was very similar in triode mode (fig.12), though the distortion was higher in the midrange than it was in Ultralinear mode.
Fig.11 Cary SLI-80HS, Ultralinear mode, 4 ohm tap, THD+N (%) vs frequency at 6.33V into: 8 ohms (left channel blue, right red), 4 ohms (left cyan, right magenta).
Fig.12 Cary SLI-80HS, Triode mode, 4 ohm tap, THD+N (%)vs frequency at 6.33V into: 8 ohms (left channel blue, right red), 4 ohms (left cyan, right magenta).
The waveform of the distortion content (fig.13, lower trace), taken from the 4 ohm tap in Triode mode at 6.33V into 8 ohms, which is equivalent to 5W, appears to be predominantly second- and third-harmonic in nature. Both this, and the difference in linearity exhibited by the SLI-80HS's two channels, can be seen in fig.14, which shows the spectrum of the SLI-80HS's output at 5Wpc from the 4 ohm tap in Ultralinear mode. As expected from fig.11, the distortion levels with a 50Hz tone are high, with the second harmonic in the right channel (red trace) lying at –39dB (1.1%). Repeating the spectral analysis with a 1kHz tone at the same power (fig.15) indicates that both the second and third harmonics are now much lower in level, at close to –60dB (0.1%).
Fig.13 Cary SLI-80HS, Triode mode, 4 ohm output tap, 1kHz waveform at 5W into 8 ohms (top), 0.235% THD+N; distortion and noise waveform with fundamental notched out (bottom, not to scale).
Fig.14 Cary SLI-80HS, Ultralinear mode, 4 ohm tap, spectrum of 50Hz sinewave, DC–10kHz, at 5W into 8 ohms (left channel blue, right red; linear frequency scale).
Fig.15 Cary SLI-80HS, Ultralinear mode, 4 ohm tap, spectrum of 1kHz sinewave, DC–10kHz, at 5W into 8 ohms (left channel blue, right red; linear frequency scale).
Finally, when fed an equal mix of 19kHz and 20kHz tones, with the peak signal level reaching 5W in ohms, the SLI-80HS in triode mode produced a 1kHz difference tone at –68dB (0.04%) and the higher-order products closer to –60dB (fig.16).
Fig.16 Cary SLI-80HS, Ultralinear mode, 4 ohm tap, HF intermodulation spectrum, DC–30kHz, 19+20kHz at 5W peak into 8 ohms (linear frequency scale).
Overall, though the Cary SLI-80HS's measured performance is what I would expect from a tubed design that uses a push-pull pair of KT88 output tubes and a limited degree of overall negative feedback, I remain bothered by the differences in noise and low-frequency linearity between the channels. Ultralinear mode gives the lowest midrange distortion and the highest power, at the expense of a higher output impedance than triode mode. But whichever mode the user prefers, the SLI-80HS's 4 ohm output taps will work better than the 8 ohm taps with all but high-impedance loudspeakers.—John Atkinson


