Sidebar 3: Measurements
I measured the Chord DAVE with my Audio Precision SYS2722 system (see the January 2008 "As We See It"), using both the Audio Precision's optical and electrical digital outputs and USB data sourced from my MacBook Pro running on battery power with Pure Music 3.0 playing WAV and AIFF test-tone files. Apple's USB Prober utility identified the Chord as "Dave" from "Chord Electronics Ltd," with the serial number "413-001." The DAVE's USB port operated in the optimal isochronous asynchronous mode. Apple's AudioMIDI utility revealed that, via USB, the DAVE accepted 32-bit integer data sampled at all rates from 32 to 768kHz. The optical input locked to datastreams with sample rates up to 96kHz, the AES/EBU and S/PDIF inputs locked to streams of up to 192kHz-sampled data.
In variable mode, the Chord's maximum output level at 1kHz with the volume control set to "0dB" was 8.75V from the balanced output jacks, 4.375V from the unbalanced jacks and the headphone jack. With the volume control set to "+3dB," the levels were 12.35V balanced and 6.18V unbalanced, but the DAVE clipped with full-scale data at settings of "+3dB" and above. In Fixed mode, the maximum balanced output level at 1kHz was 6.2V, equivalent to setting the volume control to "–3dB." All three outputs preserved absolute polarity (ie, were non-inverting) with Phase set to Pos. The XLR jacks are wired with pin 2 hot. The output impedance from the unbalanced and headphone jacks was extraordinarily low, at 0.5 ohm. The balanced output impedance was a still-low 66 ohms at all audio frequencies.
Fig.1 shows the DAVE's impulse response with 44.1kHz data. It is typical of a time-symmetrical FIR type, but with many more coefficients than I usually see. This is a long filter. In fact, with the pulse-stream signal I use, the impulse response hasn't finished decaying before the next impulse arrives. Tested with white noise sampled at 44.1kHz (footnote 1), the Chord's output rolled off extraordinarily quickly above 20kHz (fig.2, red and magenta traces). The filter reached full attenuation by the Nyquist frequency, 22.05kHz (fig.2, vertical green line), meaning that the aliased image of a full-scale 19.1kHz tone (blue, cyan) at 25kHz is completely eliminated. Note also how low the distortion harmonics of that tone are.


Footnote 1: My thanks for Jürgen Reis of MBL for suggesting this test to me.
Fig.1 Chord DAVE, impulse response (one sample at 0dBFS, 44.1kHz sampling, 4ms time window).
Fig.2 Chord DAVE, wideband spectrum of white noise at –4dBFS (left channel red, right magenta) and 19.1kHz tone at 0dBFS (left blue, right cyan), with data sampled at 44.1kHz (20dB/vertical div.).
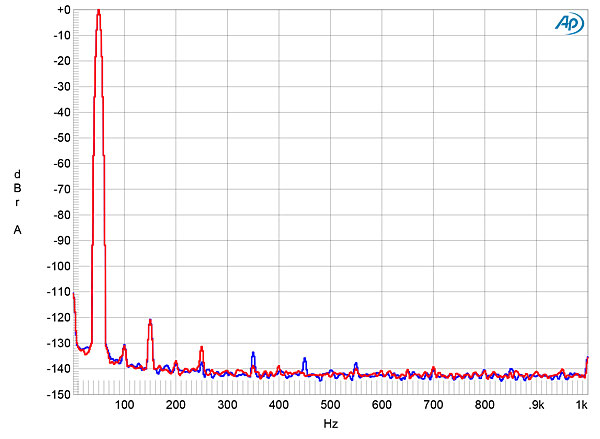
The DAVE's frequency response with data sampled at 44.1, 96, 192, and 384kHz is shown in fig.3. At the three lower rates, the rolloff follows the same basic shape, with a very sharp rolloff just below the Nyquist frequency. Only with 384kHz data (blue and green traces) does the ultrasonic rolloff continue smoothly, reaching –13.3dB at 190kHz. This graph was taken with the HF filter off. With it turned on (not shown), the response was down by 3dB at 40kHz with 96kHz data and by 8dB at 60kHz with 192kHz data. Channel separation was superb, at >125dB in both directions below 1kHz, decreasing to a still-excellent 95dB at the top of the audioband. The low-frequency noise floor (fig.4) was commendably free from any power-supply–related spuriae.
Fig.3 Chord DAVE, HF filter off, frequency response at –12dBFS into 100k ohms with data sampled at: 44.1kHz (left channel green, right gray), 96kHz (left cyan, right magenta), 192kHz (left blue, right red), 384kHz (left blue, right gray) (1dB/vertical div.).
Fig.4 Chord DAVE, spectrum with noise and spuriae of dithered 24-bit, 1kHz tone at: 0dBFS (left channel blue, right red), –60dBFS (left green, right gray) (20dB/vertical div.).
When I changed the bit depth of the incoming data from 16 to 24 with a dithered tone at –90dBFS, the noise floor dropped by 23dB (fig.5), implying resolution close to 20 bits, which is state-of-the-art DAC performance. With 24-bit USB data, the spectrum (fig.6) was completely free from harmonic and suply-related spuriae. However, while the three DC voltage levels of an undithered tone at exactly –90.31dBFS were well defined, the Chord's reproduction of them was obscured by high-frequency random noise (fig.7). This graph was taken with the HF filter off; the waveform became no cleaner with the filter switched on. With undithered 24-bit data, the DAVE output a noisy sinewave (not shown).
Fig.5 Chord DAVE, spectrum with noise and spuriae of dithered 1kHz tone at –90dBFS with: 16-bit data (left channel cyan, right magenta), 24-bit data (left blue, right red) (20dB/vertical div.).
Fig.6 Chord DAVE, spectrum with noise and spuriae of dithered 1kHz tone at –90dBFS with 24-bit USB data (left channel blue, right red) (20dB/vertical div.).
Fig.7 Chord DAVE, waveform of undithered 1kHz sinewave at –90.31dBFS, 16-bit TosLink data (left channel blue, right red).
As implied by fig.2, the DAVE had extraordinarily low harmonic distortion, even into the punishing 600 ohm load (fig.8), where the only significant harmonic was the third—if you can call something at –120dB (0.0001%) "significant." Intermodulation distortion was similarly vanishingly low (fig.9). When I tested for word-clock–related jitter rejection with 16-bit TosLink J-Test data (fig.10), all the odd-order harmonics of the LSB-level, low-frequency squarewave were at the correct levels (green line), and no jitter-related sidebands are visible. With 24-bit J-Test data (fig.11), the spectrum is free from any jitter artifacts; all that can be seen is the very low level of random noise.
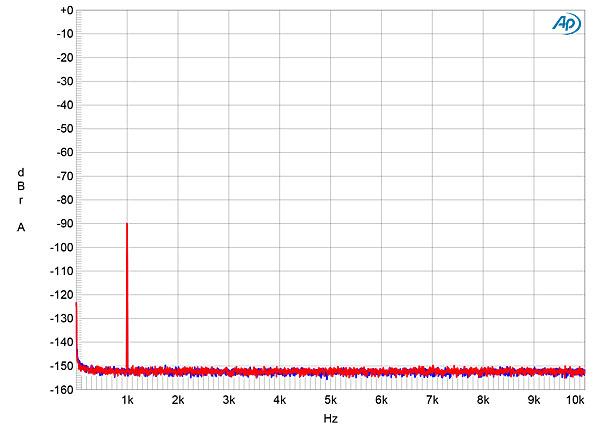
Fig.8 Chord DAVE, volume control set to "0dB," spectrum of 50Hz sinewave, DC–1kHz, at 0dBFS into 600 ohms (left channel blue, right red; linear frequency scale).
Fig.9 Chord DAVE, HF filter on, volume control set to "0dB," HF intermodulation spectrum, DC–30kHz, 19+20kHz at 0dBFS into 600 ohms, 44.1kHz data (left channel blue, right red; linear frequency scale).
Fig.10 Chord DAVE, high-resolution jitter spectrum of analog output signal, 11.025kHz at –6dBFS, sampled at 44.1kHz with LSB toggled at 229Hz: 16-bit TosLink data (left channel blue, right red). Center frequency of trace, 11.025kHz; frequency range, ±3.5kHz.
Fig.11 Chord DAVE, high-resolution jitter spectrum of analog output signal, 11.025kHz at –6dBFS, sampled at 44.1kHz with LSB toggled at 229Hz: 24-bit TosLink data (left channel blue, right red). Center frequency of trace, 11.025kHz; frequency range, ±3.5kHz.
Even if I hadn't auditioned Chord's DAVE, I would have been impressed by this DAC. Its measured performance is beyond reproach.—John Atkinson
Footnote 1: My thanks for Jürgen Reis of MBL for suggesting this test to me.


