Sidebar 3: Measurements
I measured the EAR Acute Classic with my Audio Precision SYS2722 system (see the January 2008 "As We See It"). As well as the Audio Precision's optical and coaxial S/PDIF outputs, I used WAV and AIFF test-tone files sourced via USB from my MacBook Pro running on battery power with Pure Music 3.0. Apple's USB Prober utility identified the EAR DAC as "xCORE USB Audio 2.0" from "XMOS" and confirmed that its USB port operated in the optimal isochronous asynchronous mode. Apple's AudioMIDI utility revealed that, via USB, the Acute Classic accepted 16- and 24-bit integer data sampled at all rates from 44.1 to 384kHz. The optical and coaxial S/PDIF inputs locked to datastreams with sample rates of up to 192kHz.
I tested the Acute Classic's error correction with the Pierre Verany Digital Test CD, which has graduated gaps in the data spiral. The EAR played without glitches until the dropouts in the pit spiral reached 2mm in length. This is excellent performance. (The CD standard specifies only that a player cope with gaps up to 0.2mm long.)
The EAR's output with 0dBFS data at 1kHz and its volume control set to its maximum was 6.59V from the balanced output, 6.52V from the unbalanced output, and 3.26V from the headphone output. All three outputs preserved absolute polarity—ie, were non-inverting. The output impedance was a low 29 ohms at low and middle frequencies from the balanced output, but rose to 61 ohms at the top of the audioband. From the unbalanced jacks the output impedance was a little higher—37 ohms at 20Hz, and 1kHz and 79 ohms at 20kHz—while from the headphone output the impedance was 67 ohms across the audioband, which is too high for many popular headphones. (Art Dudley's AudioQuest NightHawks measure 23 ohms, for example.)
The Acute Classic's impulse response with 44.1kHz-sampled data (fig.1) reveals its digital reconstruction filter to be a standard finite impulse response (FIR) type, with symmetrical ringing surrounding the single sample at 0dBFS. The red and magenta traces in fig.2 show that this filter rapidly rolls off the ultrasonic response, though the rolloff actually begins below 20kHz. As a result, a full-scale tone at 19.1kHz was suppressed by 6dB or so (fig.2, blue and cyan traces), and while the second and third harmonics, respectively at 38.2 and 57.3kHz, are visible in this graph, there is much strong spectral component visible just below 70kHz. There is also a strange rise in the noise floor with the white-noise signal at the same frequency. Perhaps more significant, symmetrical sidebands are visible around the 19.1kHz tone (fig.3); although this graph was created with USB data, which should be immune to serial-data jitter, this behavior is most likely due to jitter.


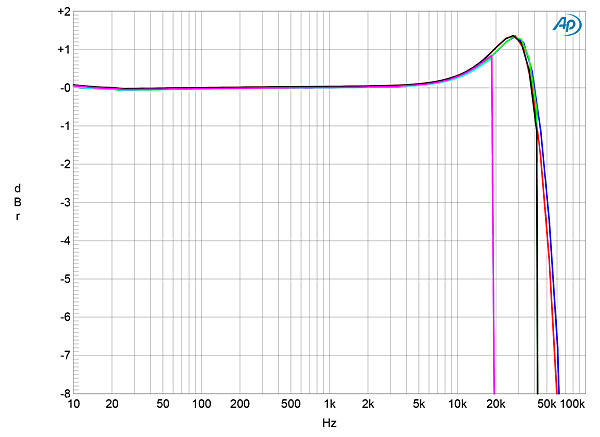
 Fig.4 shows the EAR player's frequency response, taken with S/PDIF data at 44.1, 96, and 192kHz. The response follows the same basic shape at all three rates, with a sharp rolloff above 19kHz with 44.1kHz data, and above 42kHz with 96kHz data. A suspicious rise above 10kHz reaches +1.4dB at 38kHz, perhaps due to the output transformers. This graph was taken from the balanced outputs into 100k ohms; the unbalanced outputs behaved no differently.


 With the volume control set to its maximum, which was how AD felt it sounded at its best, the EAR player produced relatively high levels of distortion from all its outputs, even into a high 100k ohms (fig.11). (AD's Shindo Haut-Brion amplifier has an input impedance of 100k ohms.) Setting the control to its midpoint, 12:00 o'clock position reduced the levels of all harmonics by 17dB or so, and the EAR offered lower levels of distortion at higher frequencies, even with the volume control set to its maximum position (fig.12). This distortion rose only slightly with the punishing 600 ohm load. I then tested the Acute with an equal mix of 19 and 20kHz tones at –6dBFS (fig.13; the combined waveform peaks at 0dBFS). Although the intermodulation distortion was low—the difference product at 1kHz lies at –86dB (0.006%)—a large number of jitter-related sidebands can be seen.

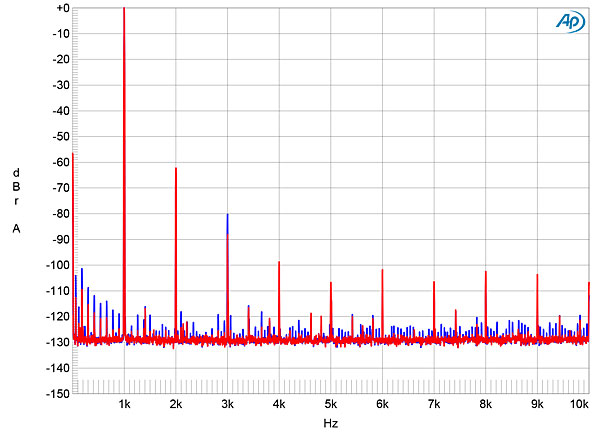


Fig.1 EAR Acute Classic, impulse response (one sample at 0dBFS, 44.1kHz sampling, 4ms time window).
Fig.2 EAR Acute Classic, wideband spectrum of white noise at –4dBFS (left channel red, right magenta) and 19.1kHz tone at 0dBFS (left blue, right cyan), with data sampled at 44.1kHz (20dB/vertical div.).
Fig.3 EAR Acute Classic, spectrum with noise and spuriae of dithered 24-bit, 19.1kHz tone at 0dBFS (left channel blue, right red; 20dB/vertical div.).
Fig.4 EAR Acute Classic, frequency response at –12dBFS into 100k ohms with data sampled at: 44.1kHz (left channel cyan, right magenta), 96kHz (left green, right gray), 192kHz (left blue, right red) (0.5dB/vertical div.).
The Acute Classic offered disappointing channel separation: just 26dB in both directions at 20kHz, 54dB at 1kHz, and just above 70dB in the bass (fig.5). Fig.6 indicates that its low-frequency noise floor has supply-related spuriae at the AC supply frequency of 60Hz and its odd harmonics. These are most likely due to magnetic interference from the power transformer being picked up by ferrous components, perhaps the tubes' steel pins.
Fig.5 EAR Acute Classic, channel separation (R–L blue, L–R red; 10dB/vertical div.)
Fig.6 EAR Acute Classic, spectrum with noise and spuriae of dithered 24-bit, 1kHz tone at 0dBFS (left channel blue, right red; 20dB/vertical div.).
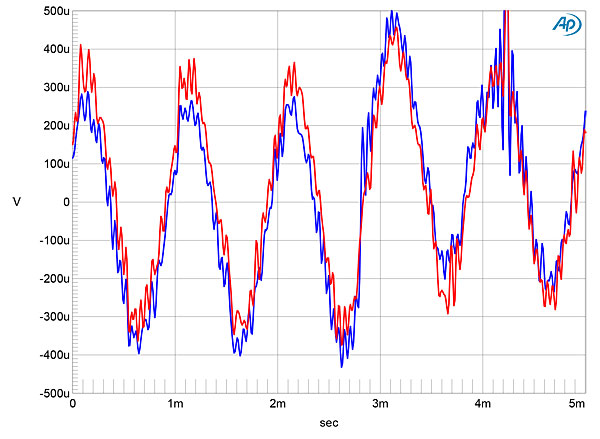
Those spuriae are also visible in the spectrum of the EAR's output while it reproduced dithered 16- and 24-bit 1kHz tones at –90dBFS (fig.7). Although it's fair to note that the spuriae above 1kHz all lie at or below –120dBFS, particularly in the right channel, this is still at the LSB level with 16-bit data. Also note that with 24-bit data (blue and red traces), the 1kHz tone is accompanied by distortion harmonics at 2, 3, and 5kHz. With 24-bit USB data (fig.8), the third, fifth, seventh, and ninth harmonics are visible, which suggests that there is something suboptimal in the EAR DAC's handling of hi-rez data. With undithered data at exactly –90.31dBFS (fig.9), the waveform is correct, with the three DC voltage levels described by the data clearly evident. With 24-bit undithered data, the result was a noisy sinewave (fig.10).
Fig.7 EAR Acute Classic, spectrum with noise and spuriae of dithered 1kHz tone at –90dBFS with: 16-bit data (left channel cyan, right magenta), 24-bit data (left blue, right red) (20dB/vertical div.).
Fig.8 EAR Acute Classic, spectrum with noise and spuriae of dithered 1kHz tone at –90dBFS with 24-bit data (left blue, right red) (20dB/vertical div.).
Fig.9 EAR Acute Classic, waveform of undithered 1kHz sinewave at –90.31dBFS, 16-bit data (left channel blue, right red).
Fig.10 EAR Acute Classic, waveform of undithered 1kHz sinewave at –90.31dBFS, 24-bit data (left channel blue, right red).
Fig.11 EAR Acute Classic, volume control set to maximum, spectrum of 50Hz sinewave, DC–1kHz, at 0dBFS into 100k ohms (left channel blue, right red; linear frequency scale).
Fig.12 EAR Acute Classic, volume control set to maximum, spectrum of 1kHz sinewave, DC–10kHz, at 0dBFS into 100k ohms (left channel blue, right red; linear frequency scale).
Fig.13 EAR Acute Classic, volume control set to maximum, HF intermodulation spectrum, DC–30kHz, 19+20kHz at 0dBFS into 100k ohms, 44.1kHz data (left channel blue, right red; linear frequency scale).
When I tested for jitter using a CD on which I've burned 16-bit J-Test data—a high-level tone at 11.025kHz and an LSB-level squarewave, both recorded without dither—the resultant spectrum was very poor (fig.14): All of the odd-order harmonics of the squarewave were about 20dB higher than they should be, and those closest to the spectral spike that represents the high-level tone were even higher. (The correct levels are indicated by the sloping green line.) Repeating the test with 16-bit optical S/PDIF data gave an even worse result (fig.15). Not only are most of the harmonics missing, but a symmetrical pair of sidebands of unknown origin is present at ±2.95kHz. And, as with the other spectral analyses, this behavior was no different with USB data.
Fig.14 EAR Acute Classic, high-resolution jitter spectrum of analog output signal, 11.025kHz at –6dBFS, sampled at 44.1kHz with LSB toggled at 229Hz: 16-bit CD data (left channel blue, right red). Center frequency of trace, 11.025kHz; frequency range, ±3.5kHz.
Fig.15 EAR Acute Classic, high-resolution jitter spectrum of analog output signal, 11.025kHz at –6dBFS, sampled at 44.1kHz with LSB toggled at 229Hz: 16-bit TosLink data (left channel blue, right red). Center frequency of trace, 11.025kHz; frequency range, ±3.5kHz.
Although predicting the influence on sound quality of the EAR Acute Classic's poor rejection of jitter is difficult, I do suspect that AD's reporting of there being "an excess of high-frequency texture," and sound quality that was "slightly grain[y]," is related to this behavior. As much as I admire Tim de Paravicini's expertise as an analog engineer, the EAR's digital circuitry is not up to the standard I expect from him.—John Atkinson


