Sample 2 Measurements, from March 2017 (Vol.40 No.3)
When I measured the original sample of EAR's $6795 Acute Classic CD player (serial no. 615-002-A550), for Art Dudley's review of it in the February 2017 issue, I found that its output with 0dBFS data at 1kHz and its volume control set to its maximum was 6.59V from the balanced output, 6.52V from the unbalanced output, and 3.26V from the headphone output. When EAR's Tim de Paravicini read the preprint of the review (we send these so that the manufacturer or distributor can submit a comment for publication), he felt that there may have been something wrong with that particular sample, as the maximum output level from the balanced and unbalanced line outputs should have been 5V. I therefore agreed to accept a second sample of the Acute Classic, to both measure and audition. The second sample (serial no. 644-014-A550) arrived after the February issue had been printed.
Before I shipped the second sample to Art Dudley for him to listen to, I examined its test-bench performance with my Audio Precision SYS2722 system (see the January 2008 "As We See It"). All of the measurements were taken with the volume control set to its maximum, which is how Art had preferred the sound of the original sample, and from its balanced outputs. While the frequency response, channel separation, and line output impedances were all the same as I had found with the first sample, the maximum output levels were now 5.1V (balanced), 5.0V (unbalanced), and 2.57V (headphone). In addition, the headphone output impedance now ranged between 5.7 and 7.8 ohms, depending on frequency, instead of the original sample's 67 ohms, a change that Tim de Paravicini had implemented in production so that the Acute Classic would work better with low-impedance headphones (footnote 1).


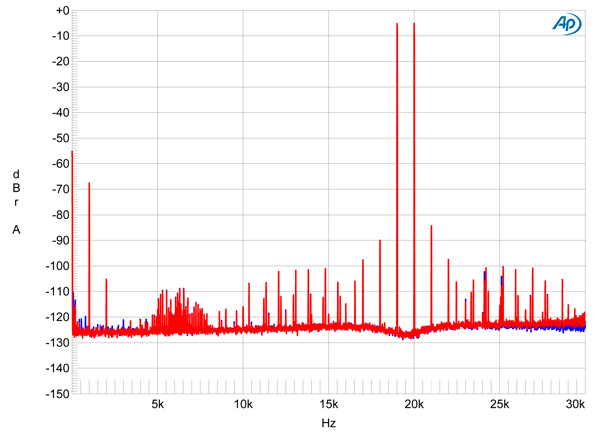
On the other hand, though the noise floor with the player decoding an equal mix of 19 and 20kHz tones, each at –6dBFS with 24-bit data (fig.5), was cleaner than it had been with the first sample, the difference component at 1kHz had risen from –86dB (0.006%) to –68dB (0.033%).

What matters most, of course, is how the new sample of EAR's Acute Classic CD player sounds. And for that, I hand you over to Art Dudley.—John Atkinson
Footnote 1: EAR says that the headphone output impedance of existing units can easily be reduced should their owners require it.
Fig.1 EAR Acute Classic, new sample, spectrum with noise and spuriae of dithered 24-bit, 1kHz tone at 0dBFS (left channel blue, right red; 20dB/vertical div.).
Fig.2 EAR Acute Classic, new sample, waveform of undithered 1kHz sinewave at –90.31dBFS, 16-bit data (left channel blue, right red).
There were other improvements in the measured performance. For example, fig.1 shows a spectral analysis of the EAR's noise floor while it reproduced a full-scale 24-bit, 1kHz tone. The original sample had components at 60 and 180Hz approaching –100dB in level, particularly in the left channel. These components, which are most likely due to magnetic interference from the AC transformer, are 6–10dB lower in level with the new sample. They would not have been audible with the original sample, but it was good to see the reduced levels. And the new sample's reproduction of an undithered 16-bit tone at exactly –90.31dBFS (fig.2) implied that the reconstruction filter was now a minimum-phase type rather than the linear-phase type used before.
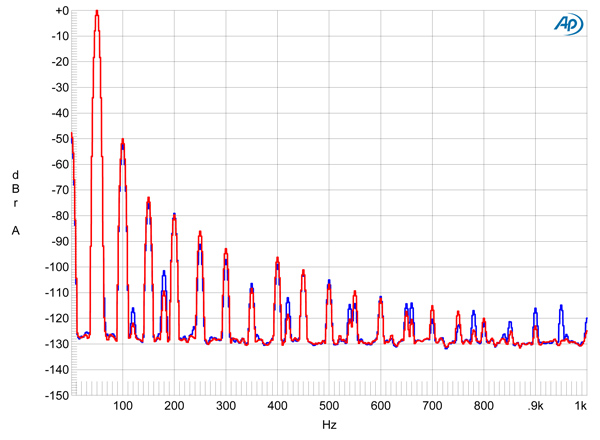
Fig.3 EAR Acute Classic, original sample, volume control set to maximum, spectrum of 50Hz sinewave, DC–1kHz, at 0dBFS into 100k ohms (left channel blue, right red; linear frequency scale).
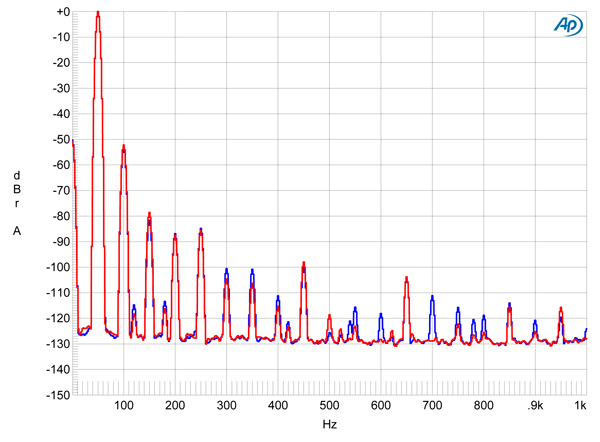
Fig.4 EAR Acute Classic, new sample, volume control set to maximum, spectrum of 50Hz sinewave, DC–1kHz, at 0dBFS into 100k ohms (left channel blue, right red; linear frequency scale).
Although the Acute Classic's specified total harmonic distortion is on the high side, at 0.5%, de Paravicini had felt that the higher-than-specified output levels had compromised the measured performance. Fig.3 shows the spectrum of the first sample's balanced output while it reproduced a 24-bit, 50Hz tone at 0dBFS into 100k ohms. The second harmonic lies at –50dB (0.3%) in both channels, with the third harmonic at –74dB (0.02%) and the fourth at –80dB (0.01%). Fig.4 shows the spectrum, taken under identical conditions, for the second sample. The level of the second harmonic is a little lower, at –53dB (0.25%) in both channels, with the third at –80dB (0.01%) and the fourth at –86dB (0.005%).
Fig.5 EAR Acute Classic, new sample, volume control set to maximum, HF intermodulation spectrum, DC–30kHz, 19+20kHz at 0dBFS into 100k ohms, 44.1kHz data (left channel blue, right red; linear frequency scale).
Fig.6 EAR Acute Classic, new sample, high-resolution jitter spectrum of analog output signal, 11.025kHz at –6dBFS, sampled at 44.1kHz with LSB toggled at 229Hz: 16-bit CD data (left channel blue, right red). Center frequency of trace, 11.025kHz; frequency range, ±3.5kHz.
The first sample of the Acute Classic had not performed particularly well when tested for its rejection of word-clock jitter. The second sample behaved somewhat differently (fig.6). While the odd-order harmonics of the Fs/192, LSB-level squarewave are lower than they had been (fig.10 in the February review's "Measurements" sidebar), they are still not at the correct levels (indicated by the sloping green line), or are obscured by analog noise.
Footnote 1: EAR says that the headphone output impedance of existing units can easily be reduced should their owners require it.


