Sidebar 3: Measurements
I measured the E.A.T. E-Glo I's behavior with my Audio Precision SYS2722 (see the January 2008 "As We See It") with the amplifier in all four of its operating modes: with the output stage in triode and Ultralinear modes and from the 4 ohm and 8 ohm output-transformer taps. The amplifier preserved absolute polarity (ie, was noninverting) in all four modes. The amplifier's maximum voltage gain at 1kHz into 8 ohms depended on the mode and output tap. The highest gain was in Ultralinear mode from the 8 ohm tap, at 30.8dB. In triode mode from this tap, the gain was 30.0dB. The gains from the 4 ohm tap were 2dB lower in each mode.
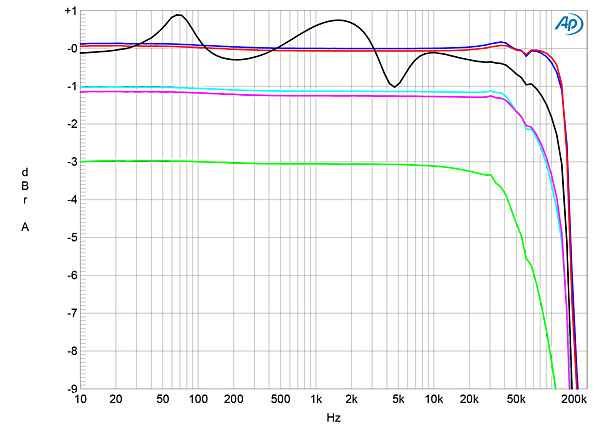
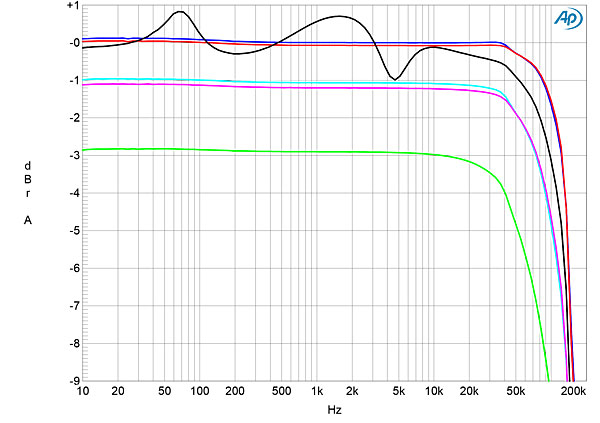
The E-Glo I's input impedance was a high 37k ohms at 20Hz and 1kHz, dropping to 33k ohms at 20kHz. The amplifier's output impedance depended on mode and output tap. In triode mode from the 4 ohm tap, the impedance was 0.77 ohms at 20Hz and 0.76 ohms at 1kHz, rising very slightly to 0.82 ohms at 20kHz. The impedances were a little higher in Ultralinear mode—0.82 ohms, 0.81 ohms, and 0.87 ohms, respectively—but these values are still relatively low for a transformer-coupled tube design. As expected, the impedances were higher from the 8 ohm tap, at 1.19 ohms at 20Hz, 1.17 ohms at 1kHz, and 1.2 ohms at 20kHz (triode) and 1.28 ohms, 1.26 ohms, and 1.29 ohms, respectively (Ultralinear). The modulation of the amplifier's frequency response due to the Ohm's law interaction between this source impedance and the impedance of our standard simulated loudspeaker reached an audible ±0.9dB in Ultralinear mode (fig.1, gray trace) and ±0.8dB in triode (fig.2, gray trace), with both graphs taken from the 8 ohm tap. The small-signal bandwidth is wide and flat to 20kHz into resistive loads in both modes (blue, red, cyan, magenta, and green traces in both graphs). The excellent channel matching was maintained at lower settings of the volume control. (Figs.1 and 2 were taken with the volume control set to its maximum.)

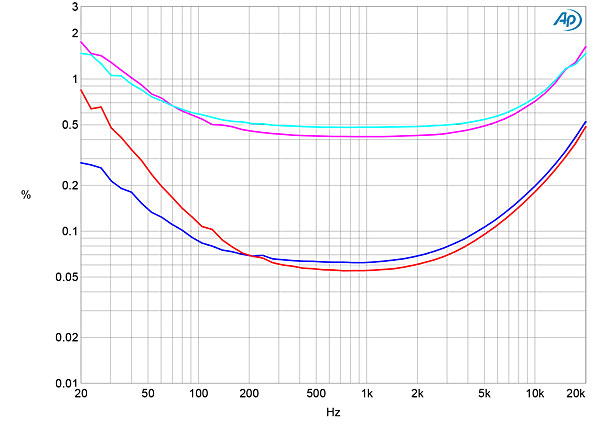
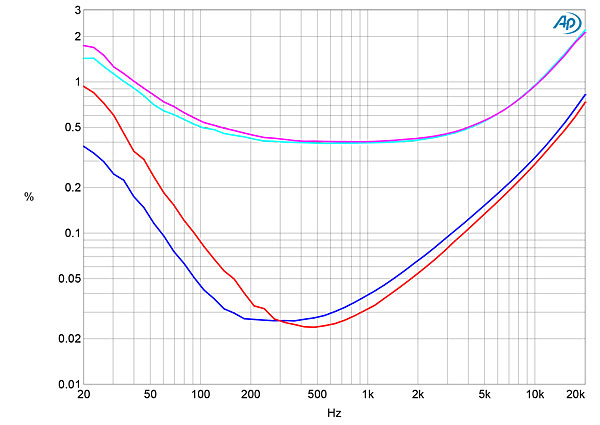
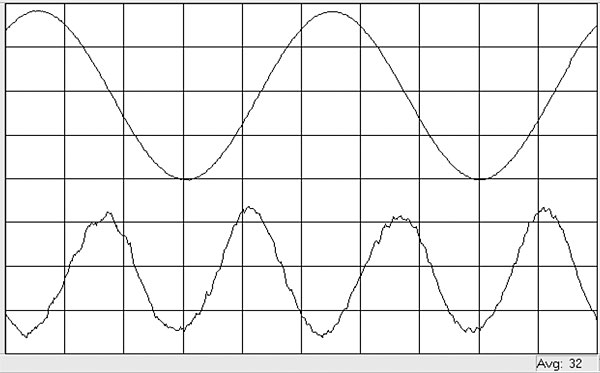
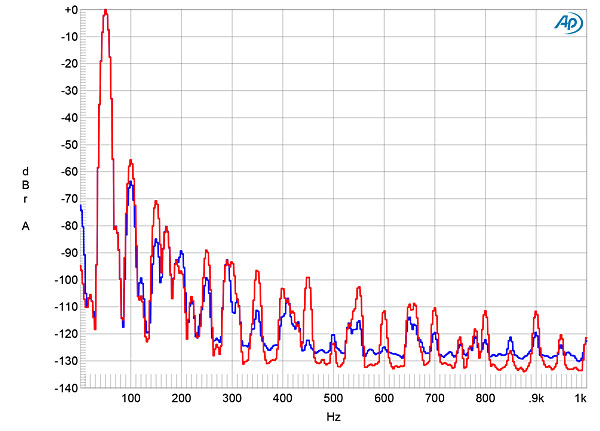
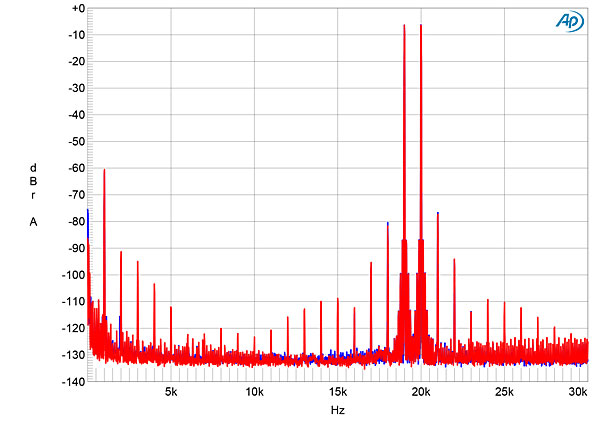
 The increase in distortion with a mismatched load can be seen in the plots of the THD+N percentage against frequency (fig.9, Ultralinear, and fig.10, triode). The THD+N was very low in the midrange into 8 ohms, especially in triode mode, but rose at higher and lower frequencies. The E-Glo I's midrange distortion in Ultralinear mode was predominantly the subjectively innocuous second harmonic (fig.11). In triode mode, the second harmonic was joined by the third at a slightly lower level. The third harmonic also made an appearance at low frequencies in Ultralinear mode (fig.12), but higher harmonics were all very low in level. When the amplifier drove an equal mix of 19 and 20kHz tones at a peak level of 3W into 8 ohms from the 8 ohm tap in triode mode (fig.13), the second-order difference product at 1kHz lay at –60dB (0.1%). At the same power in Ultralinear mode, all the intermodulation products were lower in level (not shown).
 In most ways, the E.A.T. E-Glo I's measured performance is typical of an amplifier using a push-pull pair of KT88 output tubes. However, its extended small-signal bandwidth, low noise, very good channel separation, and low distortion at powers below 10Wpc, especially in triode mode, call attention to the generally excellent audio engineering. Owners should make sure that the impedance of their loudspeakers is not lower than the value of the output tap that gives sufficient loudness.—John Atkinson
Fig.1 E.A.T. E-Glo i, Ultralinear mode, 8 ohm tap, frequency response at 2.83V into: simulated loudspeaker load (gray), 8 ohms (left channel blue, right red), 4 ohms (left cyan, right magenta), 2 ohms (green) (1dB/vertical div.).
Fig.2 E.A.T. E-Glo i, Triode mode, 8 ohm tap, frequency response at 2.83V into: simulated loudspeaker load (gray), 8 ohms (left channel blue, right red), 4 ohms (left cyan, right magenta), 2 ohms (green) (1dB/vertical div.).
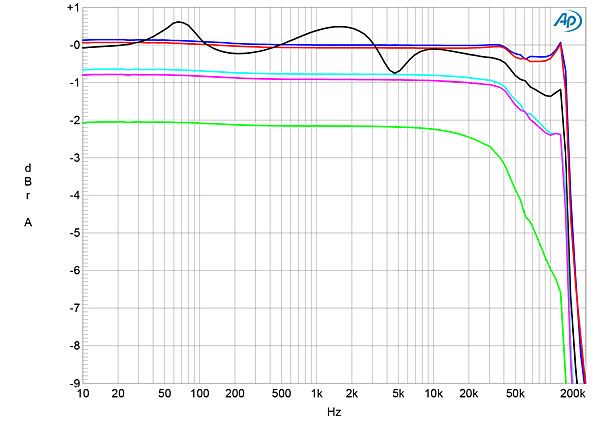
A small peak just above 100kHz started to develop in the E.A.T.'s frequency response when the load impedance was higher than the nominal transformer tap value (fig.3, blue and red traces). This is associated with a small amount of overshoot and ringing with the amplifier's reproduction of a 10kHz squarewave (fig.4). At lower frequencies, the amplifier's reproduction of squarewaves had flat tops and bottoms, confirming the E-Glo I's extended low frequencies.
Fig.3 E.A.T. E-Glo i, Ultralinear mode, 4 ohm tap, frequency response at 2.83V into: simulated loudspeaker load (gray), 8 ohms (left channel blue, right red), 4 ohms (left cyan, right magenta), 2 ohms (green) (1dB/vertical div.).
Fig.4 E.A.T. E-Glo i, Ultralinear mode, 8 ohm tap, small-signal 10kHz squarewave into 8 ohms.
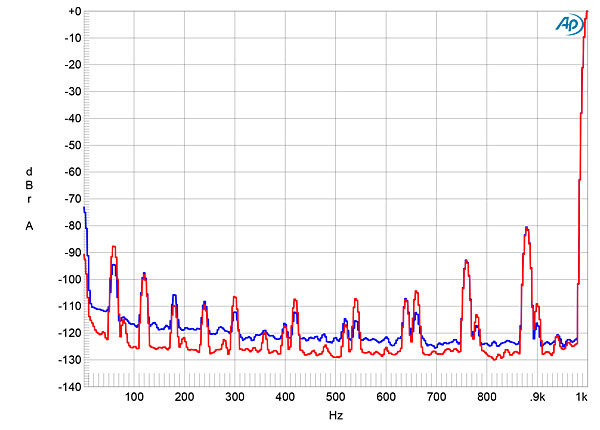
Channel separation was very good, at >80dB in both directions below 2kHz, falling to 65dB at the top of the audioband. Measured at the 8 ohm tap and taken with the inputs shorted to ground, the amplifier's unweighted, wideband signal/noise ratio in triode mode was 81.5dB (average of both channels), ref. 1W into 8 ohms. This ratio improved to 87dB, left, and 83.3dB, right, when the measurement bandwidth was restricted to the audioband, and to 96dB in both channels when A-weighted. The S/N ratios from the 4 ohm tap in triode mode were 2dB greater, correlating with the lower gain, and the ratios in Ultralinear mode were 1dB lower than in triode mode with both taps. Power supply–related spuriae in the E-Glo I's noise floor were low (fig.5), with the highest in level lying at 60Hz, this presumably due to magnetic coupling between the power and output transformers. The peak at 1kHz in this graph has sidebands at ±120Hz (?80dB) and ±240Hz (?93dB), probably due to a nonzero impedance connection from signal ground to power-supply ground somewhere in the circuit.
Fig.5 E.A.T. E-Glo i, Ultralinear mode, 8 ohm tap, spectrum of 1kHz sinewave, DC–1kHz, at 1W into 8 ohms (left channel blue, right red, linear frequency scale).
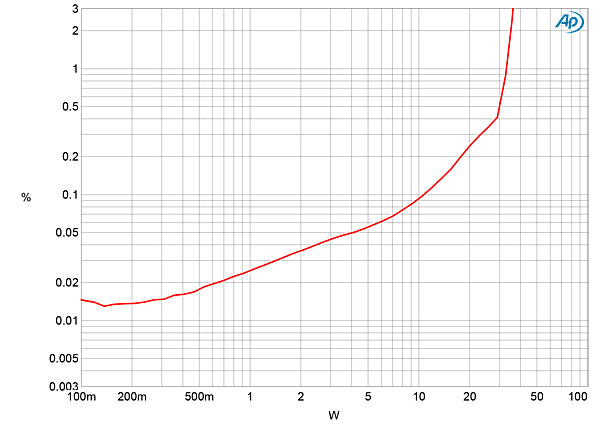
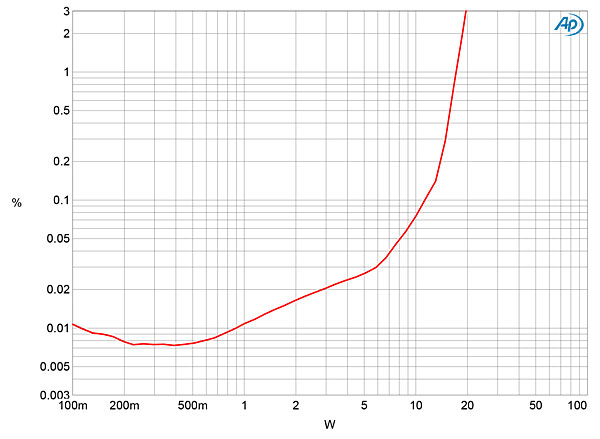
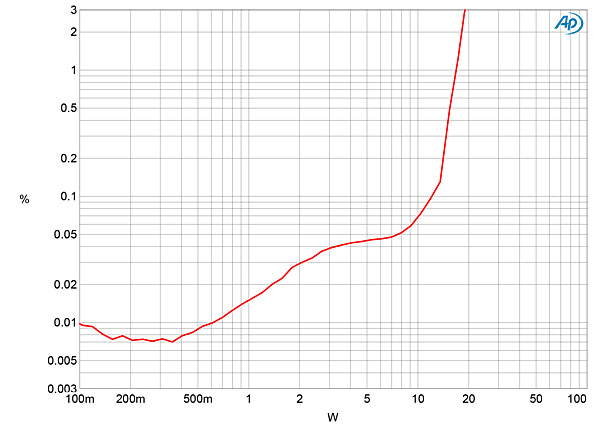
In Ultralinear mode, the E-Glo I is specified as delivering 35Wpc into 8 ohms from the 8 ohm tap (15.44dBW) and into 4 ohms from the 4 ohm tap (12.44dBW). In triode mode, the maximum specified powers are 18Wpc (12.55dBW, 8 ohms, and 9.55dBW, 4 ohms). Using our definition of clipping, which is when the output's percentage of THD+noise reaches 1%, the amplifier with both channels driven in Ultralinear mode with a 1kHz signal clipped at 33Wpc into 8 ohms (15.2dBW) from the 8 ohm output transformer tap (fig.6). The clipping power in triode mode was 17Wpc into 8 ohms (12.3dBW) from the 8 ohm tap (fig.7). As expected, less power was available when the load was not matched to the nominal transformer tap. In Ultralinear mode from the 8 ohm tap, for example, the E.A.T. clipped at 20W into 4 ohms (10dBW) and the THD+N was >0.1% even at low powers. But with matched loads, the lower-power distortion was very low, particularly in triode mode (fig.8).
Fig.6 E.A.T. E-Glo i, Ultralinear mode, 8 ohm tap, distortion (%) vs 1kHz continuous output power into 8 ohms.
Fig.7 E.A.T. E-Glo i, Triode mode, 8 ohm tap, distortion (%) vs 1kHz continuous output power into 8 ohms.
Fig.8 E.A.T. E-Glo i, Triode mode, 4 ohm tap, distortion (%) vs 1kHz continuous output power into 4 ohms.
Fig.9 E.A.T. E-Glo i, Ultralinear mode, 8 ohm tap, THD+N (%) vs frequency at 6.3V into: 8 ohms (left blue, right red), 4 ohms (left cyan, right magenta).
Fig.10 E.A.T. E-Glo i, Triode mode, 8 ohm tap, THD+N (%) vs frequency at 6.3V into: 8 ohms (left blue, right red), 4 ohms (left cyan, right magenta).
Fig.11 E.A.T. E-Glo i, Ultralinear mode, 8 ohm tap, 1kHz waveform at 3W into 8 ohms, 0.06% THD+N (top); distortion and noise waveform with fundamental notched out (bottom, not to scale).
Fig.12 E.A.T. E-Glo i, Ultralinear mode, 8 ohm tap, spectrum of 50Hz sinewave, DC–1kHz, at 3W into 8 ohms (left channel blue, right red, linear frequency scale).
Fig.13 E.A.T. E-Glo i, Triode mode, 8 ohm tap, HF intermodulation spectrum, DC–30kHz, 19+20kHz at 3W peak into 8 ohms (linear frequency scale).


