Sidebar 3: Measurements
As with the Wilson Chronosonic XVX that Michael Fremer reviewed in the May 2021 issue, it wasn't possible for us to maneuver one of the large, heavy Estelon Forza loudspeakers onto a dolly and wheel it into his driveway for the measurements. I therefore had to perform the measurements with the loudspeakers set up in Michael's room. The proximity of the room's boundaries meant that I performed my farfield frequency response measurements at 1m rather than my usual 50"; the goal is to push the reflections from those boundaries as far back in time as possible. The speakers were driven by Mikey's darTZeel NHB-468 monoblocks, and I used DRA Labs' MLSSA system, an Earthworks microphone preamplifier, and a calibrated DPA 4006 microphone to measure the Estelon Forza's behavior in the farfield. I used an Earthworks QTC-40 mike for the nearfield and spatially averaged in-room responses and Dayton Audio's DATS V2 system for the impedance measurement.
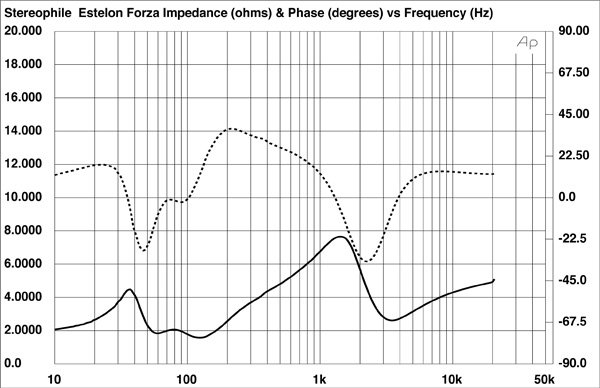
Estelon specifies the Forza's sensitivity as 88dB/2.83V/m. My estimate was the same, at 88dB(B)/2.83V/m. The Forza's impedance is specified as 3 ohms, with a minimum magnitude of 2 ohms at 42Hz and 110Hz. I found that the impedance magnitude (fig.1, solid trace) remained below 4 ohms for most of the bass, the lower midrange, and the mid-treble regions. The minimum values were 1.83 ohms at 59Hz and 1.6 ohms between 117Hz and 133Hz. The electrical phase angle (dashed trace) is occasionally high when the magnitude is low. For example, the combination of 2.7 ohms and +37° occurs at 209Hz, a frequency where music can have a high level of energy. The EPDR (footnote 1) drops to 1 ohm at 53Hz, to 0.8 ohm between 144Hz and 166Hz, and to 1.38 ohms at 2.8kHz. The Forza must be used with amplifiers that don't have problems driving 1 ohm loads.
 The single peak centered on 35Hz in the impedance magnitude trace suggests that this is the sealed-box tuning frequency of the woofers, which corresponds to the frequency where the anechoic response is down by 6dB. The red trace in fig.2 shows the response of the two woofers close to the Forza's base, measured in the nearfield. The response peaks broadly between 35Hz and 100Hz, its steep upper-frequency rolloff disturbed by a small peak at 150Hz. The blue trace is the nearfield response of the midwoofer mounted at the top of the enclosure. It takes over from the bottom woofers at 85Hz and crosses over to the midrange unit (green trace) an octave higher in frequency. These nearfield responses are plotted in the ratios of the square roots of the radiating areas; the slight excesses of energy in the blue and red traces will be an artifact of the nearfield measurement, which assumes that the radiators are mounted in a true infinite baffle, ie, one that extends to infinity in both planes.
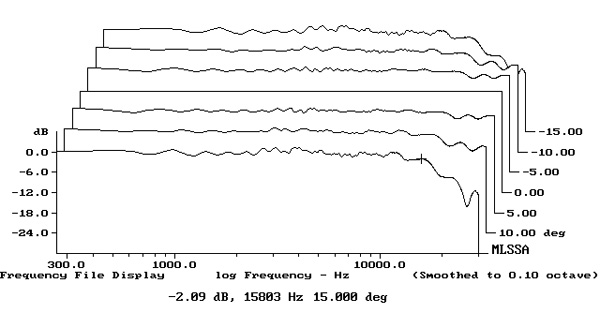
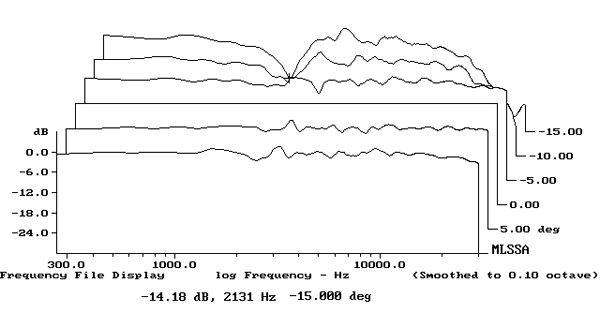
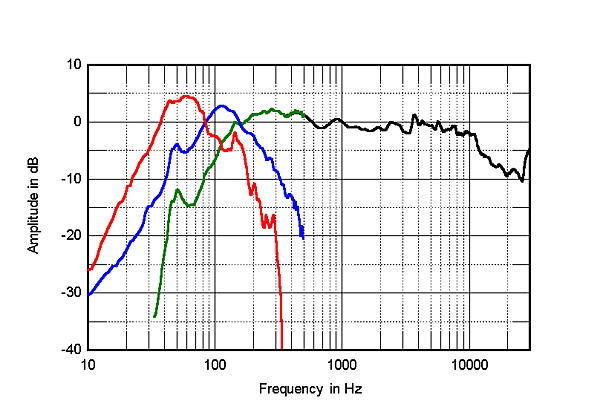 Fig.3 shows the Forza's horizontal dispersion normalized to the response on the tweeter axis, which thus appears as a straight line. (The physical limitations of performing the measurements in MF's crowded room restricted the off-axis measurements to 15° to the sides rather than my usual 90°.) The loudspeaker's radiation pattern is smooth and even, though you can see that the tweeter's output above 15kHz has dropped significantly by 15° off-axis. (This will have affected the farfield response shown in fig.2.) Fig.4 shows the Estelon's vertical dispersion, again normalized to the response on the tweeter axis, which is 42" from the floor. The response 5° below the tweeter axis, which will be close to MF's listening axis, is similar to the tweeter-axis response. The suckout in the crossover region between the midrange unit and tweeter doesn't occur until 15° above the tweeter axis.
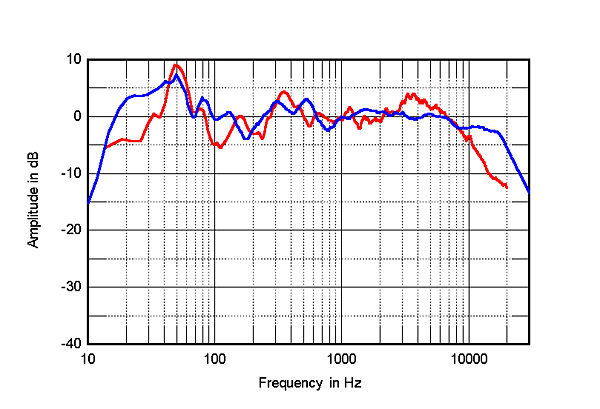
 The red trace in fig.5 shows the Estelon Forzas' 1/10-octave–smoothed, spatially averaged response in MF's room. (The spatial averaging, footnote 2, tends to average out the peaks and dips below 400Hz that are due to the room's resonant modes.) The blue trace is the 1/6-octave–smoothed spatially averaged response, measured with Fuzzmeasure 3.0 rather than MLSSA, of the Wilson Chronosonic XVXes that were being used before the Estelon Forzas were installed. Both pairs of speakers have a little too much midrange energy at the listening position, but the Estelons have significantly more energy in the mid-treble region and less in the top audio octave. Both pairs of speakers excite the room mode at 50Hz to a similar extent, though the Wilsons feature more extended lows. Even so, the Forza's output is down by just 4dB at 20Hz. This is a full-range loudspeaker!
Footnote 1: EPDR is the resistive load that gives rise to the same peak dissipation in an amplifier's output devices as the loudspeaker. See "Audio Power Amplifiers for Loudspeaker Loads," JAES, Vol.42 No.9, September 1994, and stereophile.com/reference/707heavy/index.html. Footnote 2: Using MLSSA, I averaged 20 1/10-octave–smoothed power spectra, individually taken for the left and right speakers, in a rectangular grid 36" wide by 18" high and centered on the positions of Mikey's ears.
Fig.1 Estelon Forza, electrical impedance (solid) and phase (dashed) (2 ohms/vertical div.).
The traces in fig.1 are free from the small discontinuities that would imply that resonances of some kind are present. While I was performing the response measurements, I investigated the marble-composite enclosure's vibrational behavior by listening to the panels with a stethoscope. I couldn't hear any resonant modes, even when I turned up the volume!
Fig.2 Estelon Forza, anechoic response on tweeter axis at 1m, averaged across 30° horizontal window and corrected for microphone response, with the nearfield responses of the midrange unit (green), upper woofer (blue), and lower woofers (red), respectively plotted below 500Hz, 500Hz and 325Hz.
The black trace above 500Hz in fig.2 shows the Forza's farfield response averaged across a 30° horizontal window centered on the tweeter axis. The response is very even in the midrange through to 10kHz, but there is a gentle downward slope above that frequency. As with the Magico M2 that I reviewed in February 2020, which uses a diamond-coated beryllium-dome tweeter, the Estelon's use of a pistonic tweeter with a high-Q ultrasonic dome resonance results in a lack of energy in the region below that resonance.
Fig.3 Estelon Forza, lateral response family at 1m, normalized to response on tweeter axis, from back to front: differences in response 15–5° off axis, reference response, differences in response 5–15° off axis.
Fig.4 Estelon Forza, vertical response family at 1m, normalized to response on tweeter axis, from back to front: differences in response 15–5° above axis, reference response, differences in response 5–10° below axis.
Fig.5 Estelon Forza, spatially averaged, 1/10-octave response (red) and 1/6-octave response of Wilson Chronosonic (blue) in MF's listening room, both speakers driven by darTZeel NHB 468 amplifiers.
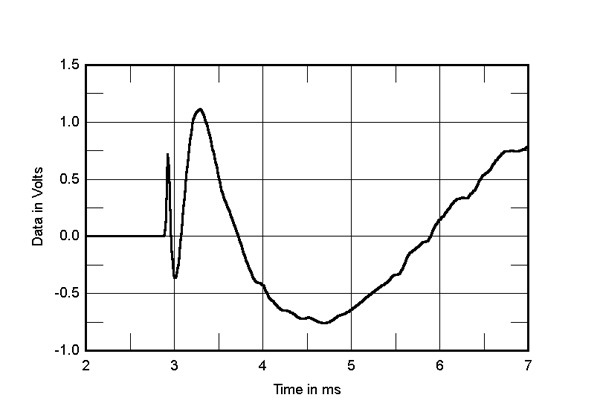
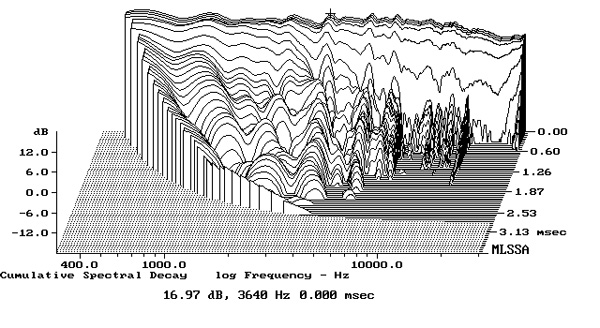
In the time domain, the Forza's step response on the tweeter axis (fig.6) reveals that the tweeter, midrange unit, and bottom woofers are all connected in positive acoustic polarity, the top midwoofer in inverted polarity. The decay of the tweeter's step smoothly blends with the positive-going start of the midrange unit's step, the decay of the midrange unit's step blends smoothly with the negative-going start of the top woofers' step, and the positive-going decay of that woofer's step smoothly blends with the start of the bottom woofers' step. Together with the profiling of the front baffle and the group delay in the crossover regions, this implies optimal implementation of the crossover filters. Other than some low-level ridges of delayed energy in the low treble, which might be due to early reflections from the baffle edges, the Forza's cumulative spectral-decay plot (fig.7) is clean, especially in the region covered by the tweeter.
Fig.6 Estelon Forza, step response on tweeter axis at 1m (5ms time window, 30kHz bandwidth).
Fig.7 Estelon Forza, cumulative spectral-decay plot on tweeter axis at 1m (0.15ms risetime).
The Forza's measured performance indicates excellent audio engineering, though that amplifier-punishing impedance will give less-than-heroic amplifiers conniptions.—John Atkinson
Footnote 1: EPDR is the resistive load that gives rise to the same peak dissipation in an amplifier's output devices as the loudspeaker. See "Audio Power Amplifiers for Loudspeaker Loads," JAES, Vol.42 No.9, September 1994, and stereophile.com/reference/707heavy/index.html. Footnote 2: Using MLSSA, I averaged 20 1/10-octave–smoothed power spectra, individually taken for the left and right speakers, in a rectangular grid 36" wide by 18" high and centered on the positions of Mikey's ears.


