Sidebar 3: Measurements
I used DRA Labs' MLSSA system and a calibrated DPA 4006 microphone to measure the Falcon LS3/5a's frequency response in the farfield, and an Earthworks QTC-40 for the nearfield response. The Falcon's voltage sensitivity was 0.7dB higher than that of my 1978 pair of Rogers LS3/5a's, at 83.2dB/2.83V/m. Its plot of impedance magnitude and phase (fig.1) was very similar to that of the original (footnote 1) with the magnitude remaining above 8 ohms from 10Hz to 7kHz. However, it was, on average, about 2 ohms lower in the region covered by the tweeter.
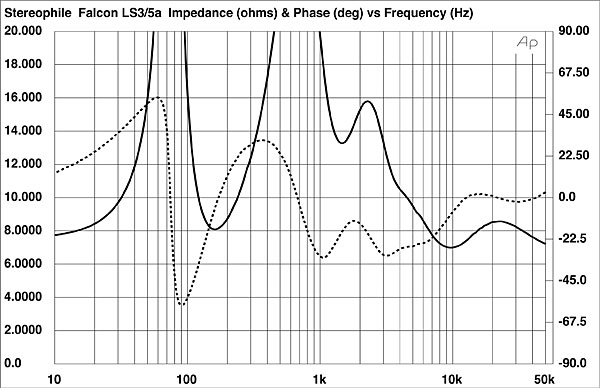
 The impedance peak of 80 ohms centered on 76Hz in fig.1 suggests that 76Hz is the tuning frequency of the sealed enclosure, which is identical to the Harbeth and the 1978 and 1989 samples of the Rogers LS3/5a's that I've tested. With the woofer's output measured in the nearfield (fig.3, black trace below 300Hz), this frequency corresponds with where the driver's output is down by 6dB, but it can be seen in fig.3 that the woofer's response peaks by about the same 6dB in the upper bass. This is the classic "LS3/5a bump," which gives the impression that this little speaker produces more bass than it actually does. However, this bump will make the speaker sensitive to excessive boundary reinforcement when not used in free space.


Footnote 1: See fig.1 here. Footnote 2: See fig.3 here.
Fig.1 Falcon LS3/5a, electrical impedance (solid) and phase (dashed) (2 ohms/vertical div.).
I investigated the vibrational behavior of the cabinet with a plastic-tape accelerometer and the speaker supported on upturned cones, which allows resonances to fully develop. I found a single high-level resonant mode on the side panels at 355Hz (fig.2)—identical to what I found on some of the earlier versions of the LS3/5a.
Fig.2 Falcon LS3/5a, cumulative spectral-decay plot calculated from output of accelerometer fastened to center of sidewall (MLS driving voltage to speaker, 7.55V; measurement bandwidth, 2kHz).
Fig.3 Falcon LS3/5a, anechoic response on tweeter axis at 50", averaged across 30° horizontal window and corrected for microphone response, with nearfield woofer response plotted below 300Hz.
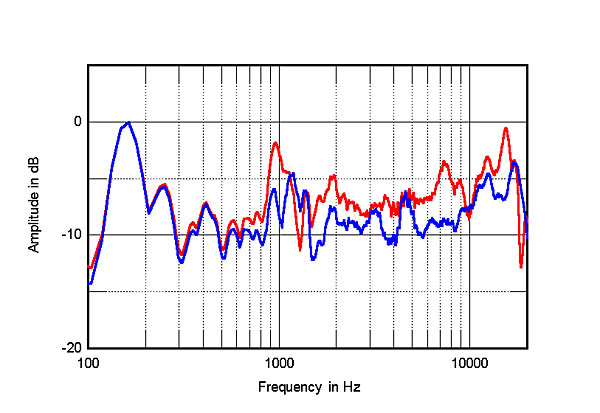
Higher in frequency in fig.3, the black trace shows the Falcon's farfield response averaged across a 30° horizontal window centered on the tweeter axis. As with all versions of the LS3/5a (footnote 2), a narrow peak in the upper midrange disturbs an otherwise relatively uniform response. Falcon's version of the original's KEF T27 tweeter produces several narrow peaks in the octave above 15kHz, and the top two octaves are shelved up a little. Fig.4, taken with pink noise on the tweeter axis, compares the in-room response of the Falcon LS3/5a (red trace) with one of my 1978 Rogers examples (blue). The low-frequency outputs are identical, but the Falcon's upper-midrange peak is more pronounced and, overall, the 2015 speaker has 2–3dB more output in the treble. This explains the Falcon's greater measured sensitivity.
Fig.4 Falcon LS3/5a (red) and 1978 Rogers LS3/5a (blue), in-room responses on tweeter axis, 100Hz–20kHz, at 50" with pink noise (5dB/vertical div.)
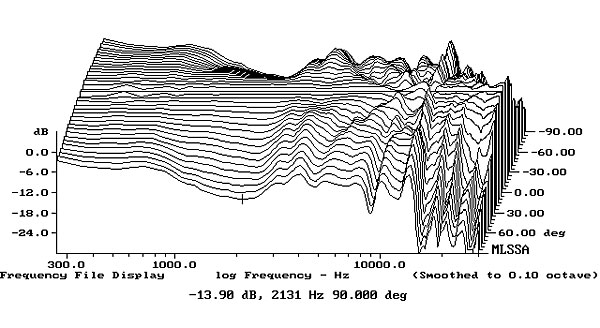
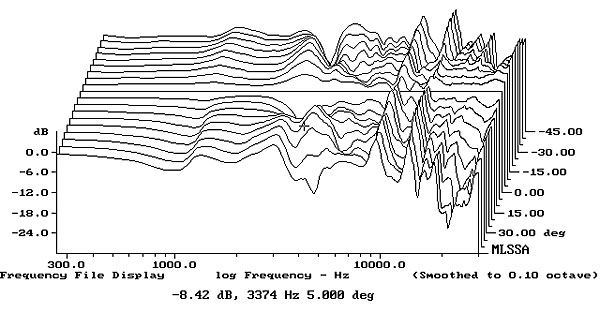
The Falcon LS3/5a's plot of lateral dispersion (fig.5) looks complex, but this is mainly due to the small dips in the on-axis response tending to fill in to the speaker's sides. However, the broad depression in the presence region off axis might make the speaker sound a little polite. In the vertical plane (fig.6), a large suckout develops in the crossover region immediately below the tweeter axis. In addition, a little more energy is present between 1 and 4kHz between 5° and 10° above the tweeter axis. Both of these factors suggest that the Falcon LS3/5a will work better on a low than on a high stand.
Fig.5 Falcon LS3/5a, lateral response family at 50", normalized to response on tweeter axis, from back to front: differences in response 90–5° off axis, reference response, differences in response 5–90° off axis.
Fig.6 Falcon LS3/5a, vertical response family at 50", normalized to response on tweeter axis, from back to front: differences in response 45–5° above axis, reference response, differences in response 5–45° below axis.
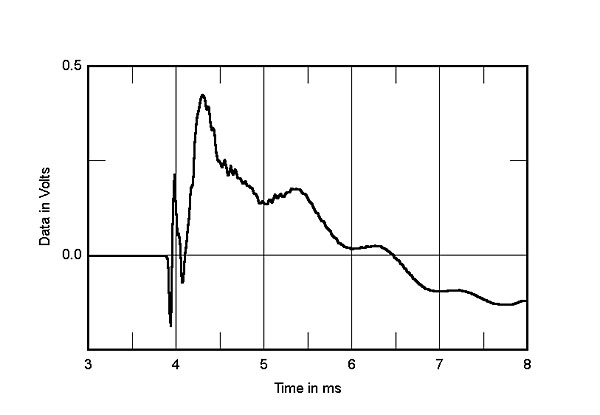
Turning to the time domain, the Falcon's step response on the tweeter axis (fig.7) is basically identical to those of the earlier versions of the LS3/5a, with the tweeter connected in inverted acoustic polarity, the woofer in positive polarity. However, a prominent ripple in the decay of the woofer's step correlates with the pronounced ridge of resonant energy centered just above 1kHz in the Falcon's cumulative spectral-decay plot (fig.8). The LS3/5a has always sounded a touch nasal, but, all things being equal, from this I would have expected the Falcon's version to sound more nasal than the original version. (HR did comment on the response rise in the upper midrange.)
Fig.7 Falcon LS3/5a, step response on tweeter axis at 50" (5ms time window, 30kHz bandwidth).
Fig.8 Falcon LS3/5a, cumulative spectral-decay plot on tweeter axis at 50" (0.15ms risetime).
Overall, its measured behavior indicates that Falcon Acoustics' re-creation of this classic British minimonitor has been very successful. The company has resisted the temptation to "improve" the sound quality, but has also managed to re-create what made the speaker great in the first place—unlike, for example, the unauthorized Gini Systems version that John Marks reviewed in December 2008.—John Atkinson
Footnote 1: See fig.1 here. Footnote 2: See fig.3 here.