Sidebar 3: Measurements
I performed a full set of measurements on the GamuT Di150 LE using my Audio Precision SYS2722 system (see the January 2008 "As We See It"). I preconditioned the amplifier by running it with both channels driven at one-third power into 8 ohms for 60 minutes. This is, thermally, the worst situation for an amplifier with a class-B or -AB output stage, as one-third power is when the output transistors dissipate the most heat. At the end of the hour, the side-mounted heatsinks were very hot, with a temperature of 135°F (57.3°C), and the temperature of the top panel was 115.1°F (46.1°C). Throughout this hour, the THD+noise measured a constant 0.004%.
The GamuT's voltage gain into 8 ohms with its volume control at the maximum setting measured 34.15dB for both balanced and unbalanced input signals. Both inputs preserved absolute polarity (ie, were non-inverting). The input impedance was close to specification, measuring 34k ohms balanced and 58k ohms unbalanced at low and middle frequencies. The impedance dropped slightly at the top of the audioband, to 33k ohms balanced and 50k ohms unbalanced, but these are still usefully high.
The Di150's output impedance was very low, at 0.09 ohm (including 6' of speaker cable) at low and middle frequencies, and rose only slightly, to 0.11 ohm, at 20kHz. The modulation of the amplifier's frequency response into our standard simulated loudspeaker was therefore minimal (fig.1, gray trace). The response rolls off a little early above the audioband, reaching –3dB at 60kHz into 8 ohms (fig.1, blue and red traces); as a result, the Di150's reproduction of a 10kHz squarewave (fig.2) had lengthened risetimes. However, there was no trace of overshoot or ringing. These graphs were taken with the volume control set to its maximum; measurements taken at lower settings were identical.


 The Di150 is specified as having a maximum output power of 180Wpc into 8 ohms and 360Wpc into 4 ohms, both powers equivalent to 22.55dBW. Figs. 4 and 5 reveal that even with both channels driven, the GamuT comfortably exceeded its specification, clipping (defined as when the THD+noise in its output reaches 1%) at 250Wpc into 8 ohms (24dBW) and 400Wpc into 4 ohms (23dBW). The downward slope of the traces in figs. 4 and 5 indicate that the distortion is actually buried in the noise below 100W or so. I therefore examined how the THD+N percentage varied with frequency at a relatively high level, 20V, which is equivalent to 50W into 8 ohms, 100W into 4 ohms, and 200W into 2 ohms. The result is shown in fig.6. The THD+N is very low below 1kHz, but rises in the top octaves due to the circuit's gain-bandwidth product not being large enough in this region to provide sufficient negative feedback to fully linearize the transfer function. Fig.6 also shows that the Di150 is less comfortable into 2 ohms (gray trace) than into higher impedances.


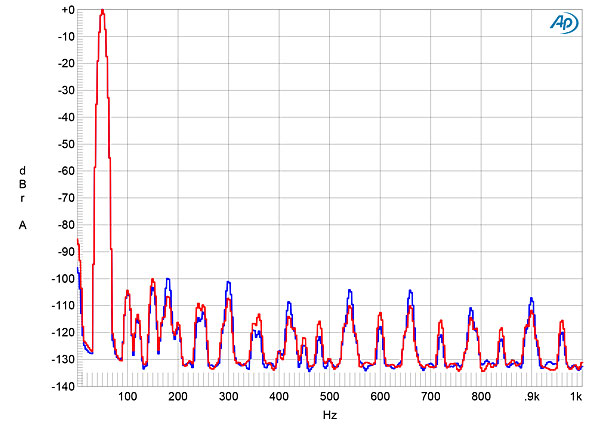

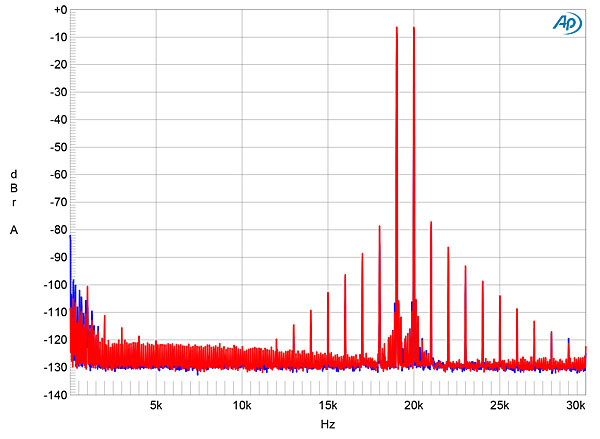
Fig.1 GamuT Di150 LE, frequency response with volume control set to its maximum at 2.83V into: simulated loudspeaker load (gray), 8 ohms (left channel blue, right red), 4 ohms (left cyan, right magenta), 2 ohms (green) (0.5dB/vertical div.).
Fig.2 GamuT Di150 LE, small-signal, 10kHz squarewave into 8 ohms.
Channel separation below 2kHz was good, at >80dB R–L and >90dB L–R, but decreased to 65 and 75dB at 20kHz. The wideband, unweighted signal/noise ratios, ref.1W into 8 ohms and taken with the inputs shorted to ground but the volume control set to its maximum, were 71.4dB in the left channel and 69.6dB in the right; these figures increased to 77.8 and 78.4dB when the measurement bandwidth was restricted to the audioband, and to 80.2 and 80.7dB when A-weighted. Spectral analysis of the Di150's low-frequency noise floor while it reproduced a 1kHz tone at 1W into 8 ohms (fig.3) revealed spuriae at the AC mains frequency of 60Hz and its odd-order harmonics. Though these all lie at or below –90dB, they are most likely due to magnetic interference from the power transformer.
Fig.3 GamuT Di150 LE, spectrum of 1kHz sinewave, DC–1kHz, at 1W into 8 ohms (linear frequency scale).
Fig.4 GamuT Di150 LE, THD+N (%) vs 1kHz continuous output power into 8 ohms.
Fig.5 GamuT Di150 LE, THD+N (%) vs 1kHz continuous output power into 4 ohms.
Fig.6 GamuT Di150 LE, THD+N (%) vs frequency at 20V into: 8 ohms (left channel blue, right red), 4 ohms (left cyan, right magenta), 2 ohms (left, gray).
The distortion signature at high powers into 8 ohms appears to be primarily the third harmonic (fig.7), accompanied by higher-order odd and even harmonics (fig.8), though all of these are at a very low level. Into the same voltage into 4 ohms, the second harmonic rose to –94dB (0.002%) in the left channel and –100dB (0.001%) in the right, compared with the level of the third harmonic, which was –97dB (0.0014%) in both channels (fig.9). Intermodulation distortion (fig.10) was also very low; the difference component at 1kHz resulting from an equal mix of 19 and 20kHz tones at a peak level of 160Wpc into 4 ohms lay below –100dB (0.001%).
Fig.7 GamuT Di150 LE, 1kHz waveform at 80W into 8 ohms, 0.0039% THD+N (blue); distortion and noise waveform with fundamental notched out (red, not to scale).
Fig.8 GamuT Di150 LE, spectrum of 50Hz sinewave, DC–1kHz, at 80W into 8 ohms (linear frequency scale).
Fig.9 GamuT Di150 LE, spectrum of 50Hz sinewave, DC–1kHz, at 80W into 8 ohms (linear frequency scale).
Fig.10 GamuT Di150, HF intermodulation spectrum, DC–30kHz, 19+20kHz at 160W peak into 4 ohms (linear frequency scale).
From its measured performance, GamuT's Di150 LE appears to be a well-engineered solid-state amplifier.—John Atkinson


