Sidebar 3: Measurements
Like Rega Research's Apollo CD player, which Art Dudley reviewed in June 2018, the Kalista DreamPlay One has no digital inputs of any kind, which limited my measurement of its technical behavior to using 16-bit test files burned to a CD-R. I tested the Kalista with my Audio Precision SYS2722 system (see the January 2008 "As We See It"), using two of the six reconstruction filters the Kalista offers: AD's preferred filter, the Super Slow Rolloff, and the default filter, Sharp Rolloff.
The Kalista's error correction was good—no interruptions were apparent in the player's output until the single gaps in the data spiral on the Pierre Verany Digital Test CD reached 1.25mm in length, when there were occasional glitches. (The Compact Disc standard, the so-called "Red Book," requires that a player cope with gaps of up to 0.2mm.) With the Kalista's output set to "2.5V," which is how AD auditioned the player, the maximum output level from the unbalanced output was 2.46V, which is 1.8dB higher than the CD standard's 2V. As expected, the maximum balanced output level was twice the unbalanced, at 4.92V. Both outputs preserved absolute polarity (ie, were non-inverting). The unbalanced output impedance was a very low 20 ohms across the audioband; the balanced impedance was 40 ohms, again at all audio frequencies.
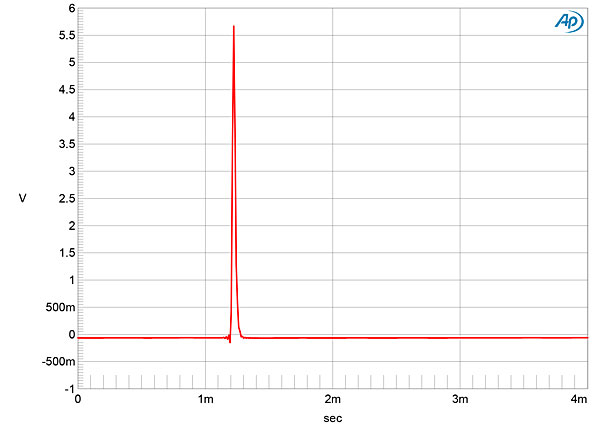
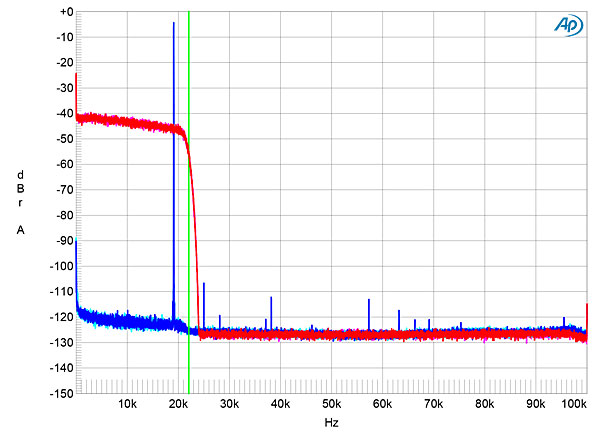
Fig.1 shows the DreamPlay One's impulse response with AD's preferred reconstruction filter, the Super Slow Rolloff: it is a perfect impulse, with no pre- or post-ringing. With the default Sharp Rolloff filter, the impulse response (fig.2) was typical of a linear-phase filter, with ringing either side of the peak, though the undershoot before the single sample at 0dBFS is larger than that immediately after. Tested with white noise sampled at 44.1kHz, the Kalista's output with the Super Slow Rolloff filter began to roll off in the top audio octaves and exhibited a slow decline in output at ultrasonic frequencies, with nulls at 44.1kHz and its harmonics (fig.3, red and magenta traces). The aliased image at 25kHz of a full-scale 19.1kHz tone (blue and cyan traces) is hardly suppressed at all, though the harmonics of that tone are well down in level. With the Sharp Rolloff filter, the output rolled off quickly above 20kHz (fig.4, red and magenta traces), and the aliased image at 25kHz of a full-scale 19.1kHz tone (blue, cyan) is suppressed by >100dB.


 Channel separation (not shown) was superb, at >100dB in both directions below 1kHz, decreasing to a still-excellent 83dB at 20kHz. The analog noise floor was low in level (fig.6), but power-supply–related artifacts can be seen at 60Hz and its odd-order harmonics. (The limited space in my test lab meant that I had to place the Kalista atop the Electra power supply, but I did raise it 6" to try to minimize magnetic interference. I tried both positions of the Electra's grounding switch with no significant changes.) Peculiarly, the spectral spike that represents the 1kHz tone in this graph shows some spreading at its base.


 Finally, when I tested the Kalista DreamPlay One with 16-bit J-Test data (fig.12), the spectral spike that represents the high-level tone at exactly one-quarter the sample rate shows some spreading at its base, though the odd-order harmonics of the LSB-level, low-frequency squarewave are close to the correct levels (sloping green line). However, sidebands can be seen spaced at ±60, ±120, and ±180Hz, etc., these perhaps due to residual power-supply ripple present on the DAC chip's voltage reference pin.

Footnote 1: Further investigation suggests that this rise in the noisefloor is due to noise-shaping used to create the test signal data.
Fig.1 Kalista DreamPlay One, Super Slow Rolloff filter, impulse response (one sample at 0dBFS, 4ms time window).
Fig.2 Kalista DreamPlay One, Sharp Rolloff filter, impulse response (one sample at 0dBFS, 4ms time window).
Fig.3 Kalista DreamPlay One, Super Slow Rolloff filter, wideband spectrum of white noise at –4dBFS (left channel red, right magenta) and 19.1kHz tone at 0dBFS (left blue, right cyan), with CD data (20dB/vertical div.).
Fig.4 Kalista DreamPlay One, Sharp Rolloff filter, wideband spectrum of white noise at –4dBFS (left channel red, right magenta) and 19.1kHz tone at 0dBFS (left blue, right cyan), with CD data (20dB/vertical div.).
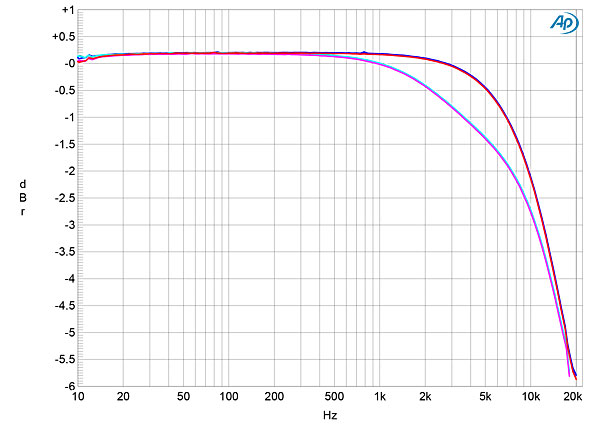
The blue and red traces in fig.5 show the audioband response, taken with spot tones, of the Kalista with the Super Slow Rolloff filter; although this graph reveals excellent channel matching, the response begins to roll off above 2kHz, reaching –3dB at 12kHz and –6dB just below 20kHz. The audioband response with the Sharp Rolloff filter rolled off almost as quickly, reaching –3dB at 15kHz. This behavior, which will add some "sweetening" to the Kalista's sound, explains why AD found the audible difference between these two filters to be very subtle: in the frequency domain, they behave almost identically below 20kHz. The cyan and magenta traces in fig.5 show the response with preemphasized data: the output above 1kHz is suppressed by an additional 1dB. Fortunately, preemphasized CDs are extremely rare.
Fig.5 Kalista DreamPlay One, Super Slow Rolloff filter, frequency response at –12dBFS into 100k ohms: without deemphasis (left channel blue, right red), with deemphasis (left cyan, right magenta) (0.5dB/vertical div.).
Fig.6 Kalista DreamPlay One, spectrum with noise and spuriae of dithered 1kHz tone at 0dBFS (left channel blue, right red) (20dB/vertical div.).
With dithered data representing a 1kHz tone at –90dBFS (fig.7), the level of the tone is correct, but the graph actually shows the spectrum of the dither noise used to encode the 16-bit test signal. With the Super Slow Rolloff filter and undithered data representing a 1kHz tone at exactly –90.31dBFS (fig.8), the waveform is symmetrical and the three DC voltage levels described by the data are well defined, but with very slight DC offsets in the two channels.
Fig.7 Kalista DreamPlay One, spectrum with noise and spuriae of dithered 16-bit, 1kHz tone at –90dBFS (left channel blue, right red) (20dB/vertical div.).
Fig.8 Kalista DreamPlay One, waveform of undithered 16-bit, 1kHz sinewave at –90.31dBFS (left channel blue, right red).
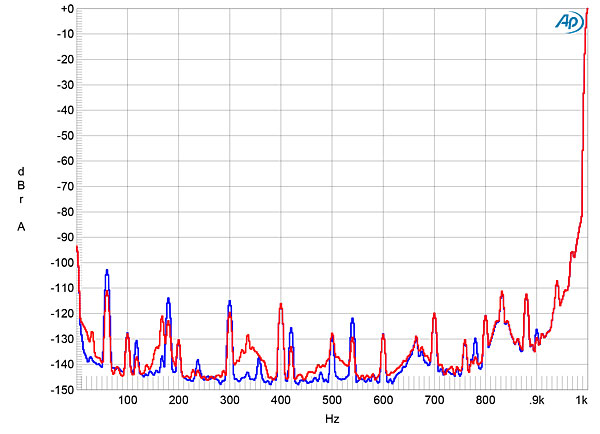
The spectrum of a full-scale 50Hz tone into 600 ohms (fig.9) indicates that, even into this demanding impedance, the distortion is low in level. The DreamPlay One's distortion signature is dominated by the second harmonic at –84dB (0.005%) and the third harmonic at –90dB (0.003%), but the spectral spreading seen in fig.6 can still be seen. I then tested the Kalista and the Super Slow Rolloff filter for intermodulation distortion with an equal mix of 19 and 20kHz tones. The resultant spectrum (fig.10) looks hashy in the audioband, and the aliased images of the two tones are hardly suppressed. Repeating the test with the Sharp Rolloff filter (fig.11) almost eliminated the aliased images, and actual intermodulation products are very low in level. However, this graph shows the same peculiar rise in the noise floor at the top of the audioband that I found with the Rega Apollo player (footnote 1).
Fig.9 Kalista DreamPlay One, spectrum of 50Hz sinewave (DC–1kHz) at 0dBFS into 600 ohms (left channel blue, right red; linear frequency scale).
Fig.10 Kalista DreamPlay One, Super Slow Rolloff filter, HF intermodulation spectrum (DC–30kHz), 19+20kHz at 0dBFS into 600 ohms (left channel blue, right red; linear frequency scale).
Fig.11 Kalista DreamPlay One, Sharp Rolloff filter, HF intermodulation spectrum (DC–30kHz), 19+20kHz at 0dBFS into 600 ohms (left channel blue, right red; linear frequency scale).
Fig.12 Kalista DreamPlay One, high-resolution jitter spectrum of analog output signal, 11.025kHz at –6dBFS, sampled at 44.1kHz with LSB toggled at 229Hz: CD data (left channel blue, right red). Center frequency of trace, 11.025kHz; frequency range, ±3.5kHz.
Other than that, the Kalista DreamPlay One demonstrates good audio engineering.—John Atkinson
Footnote 1: Further investigation suggests that this rise in the noisefloor is due to noise-shaping used to create the test signal data.


