Sidebar 3: Measurements
I used DRA Labs' MLSSA system and a calibrated DPA 4006 microphone to measure the KEF Q350's frequency response in the farfield, and an Earthworks QTC-40 for the nearfield responses. My estimate of the KEF's sensitivity was 86.6dB(B)/2.83V/m, which is within experimental error of the specified 87dB. Though the impedance magnitude (fig.1, solid trace) drops just below 4 ohms at 180Hz and there is a combination of 5 ohms and a –39° electrical phase angle at 125Hz, the speaker is a relatively easy load for the partnering amplifier. This graph was taken with the port open, hence the twin impedance peaks in the bass, which confirm that this is a reflex design. Completely blocking the port (fig.2) gives a single low-frequency peak centered at 78Hz—a fairly high tuning frequency for a sealed-box woofer alignment.


 With the Q350's port open, the minimum-motion notch in its woofer's output (fig.4, green trace) indicates that the port is tuned to 45Hz, and the port's response (blue trace) peaks between 30 and 60Hz. While some midrange liveliness can be seen in the port's output, this is relatively low in level and will be mitigated by the fact that the port faces to the Q350's rear. With the port fully blocked, the woofer's output (red trace) is down by 6dB at 45Hz, but offers greater low-bass output than the sum of the reflex-loaded woofer and port responses (black trace below 312Hz). Note that the apparent rise in the upper bass in this graph is an artifact of the nearfield measurement technique; the KEF appears to be tuned to be maximally flat.
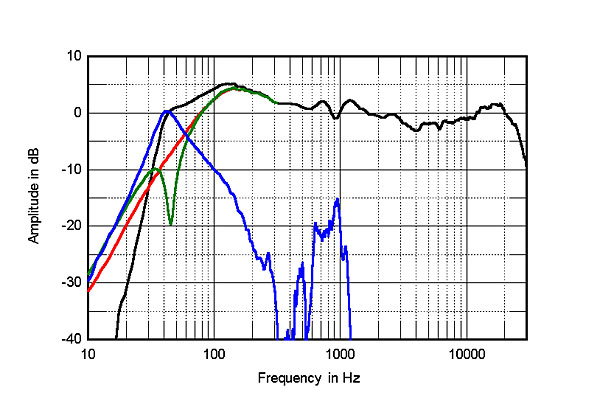

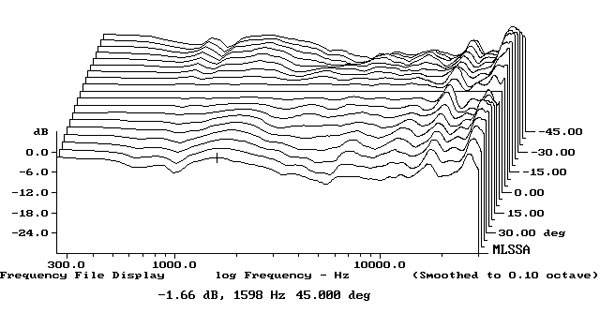
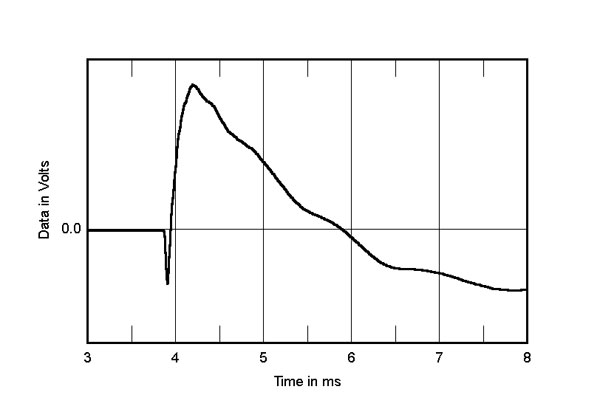

Fig.1 KEF Q350 with port open, electrical impedance (solid) and phase (dashed) (5 ohms/vertical div.).
Fig.2 KEF Q350 with port closed, electrical impedance (solid) and phase (dashed) (5 ohms/vertical div.).
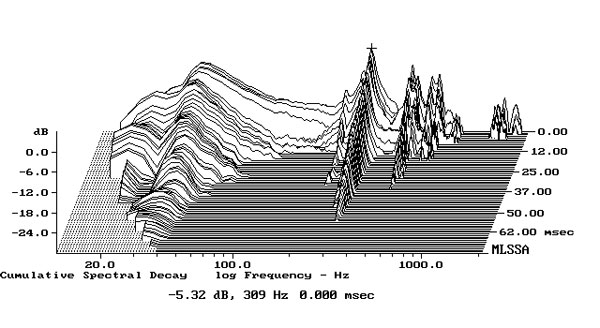
The traces in figs.1 and 2 have a small wrinkle between 600 and 700Hz, suggesting the presence of a cabinet resonance in that region. However, when I investigated the vibrational behavior of the enclosure panels with an accelerometer, there was nothing untoward between 600 and 700Hz. However, there was a fairly strong mode at 309Hz on all surfaces (fig.3), and a slightly less strong one at 504Hz.
Fig.3 KEF Q350, cumulative spectral-decay plot calculated from output of accelerometer fastened to center of sidewall (MLS driving voltage to speaker, 7.55V; measurement bandwidth, 2kHz).
Fig.4 KEF Q350, anechoic response on tweeter axis at 50", averaged across 30° horizontal window and corrected for microphone response, with nearfield responses of woofer with port blocked (red), port open (green), and port (blue), and the complex sum of the last two (black), respectively plotted below 312Hz, 312Hz, 1.2kHz, and 312Hz.
Higher in frequency in fig.4, the black trace shows the Q350's farfield response averaged across a 30° horizontal window centered on the tweeter axis. There are a slight lack of energy in the mid-treble and two small peaks between 600Hz and 1.3kHz, but the balance is otherwise even. The plot of the KEF's lateral dispersion, normalized to the tweeter-axis response (fig.5), shows excellent control of the speaker's off-axis behavior, the pattern becoming more directional in an even manner as the frequency increases. The same characteristic can be seen in the plot of the speaker's vertical dispersion (fig.6).
Fig.5 KEF Q350, lateral response family at 50", normalized to response on tweeter axis, from back to front: differences in response 90–5° off axis, reference response, differences in response 5–90° off axis.
Fig.6 KEF Q350, vertical response family at 50", normalized to response on tweeter axis, from back to front: differences in response 45–5° above axis, reference response, differences in response 5–45° below axis.
In the time domain, the step response on the tweeter axis (fig.7) indicates that the tweeter is connected in inverted acoustic polarity, the woofer in positive polarity, with the tweeter's output slightly leading the woofer's. However, the decay of the tweeter's step blends smoothly into the start of the woofer's step, suggesting optimal crossover design. The cumulative spectral-decay plot (fig.8) is superbly clean, especially considering that the Q350 is a relatively inexpensive loudspeaker.
Fig.7 KEF Q350, step response on tweeter axis at 50" (5ms time window, 30kHz bandwidth).
Fig.8 KEF Q350, cumulative spectral-decay plot on tweeter axis at 50" (0.15ms risetime).
Its rather lively enclosure apart, KEF's Q350 offers excellent measured performance.— John Atkinson


