Sidebar 3: Measurements
I examined the Lector Digitube S-192's measured behavior with my top-of-the-line Audio Precision SYS2722 system (see www.ap.com and the January 2008 "As We See It"). For some tests, and to check the results of others with a different measurement system, I used my vintage Audio Precision System One DSP.
I used my 2012-vintage Apple MacBook Pro, running on battery power, to examine the processor's performance via its USB port. Apple's USB Prober utility identified the Lector as having the manufacturer string "Lector" and the product string "Doect-Lector," though the AudioMIDI utility reported the product as being the "Lector-a." USB Prober appeared to indicate that the Digitube operated in isochronous adaptive mode rather than the preferred isochronous asynchronous mode. AudioMIDI also reported that while the USB port would accept 16- and 24-bit data (but not 32-bit), the sample rates on offer were 44.1, 48, 88.2, 96, 176.4, and 192kHz, but not the specified 384kHz. The AES/EBU and S/PDIF inputs, including TosLink, locked to datastreams with sample rates ranging from 32 to 192kHz.
The single-ended outputs preserved absolute polarity (ie, were non-inverting), and the maximum output level at 1kHz into 100k ohms was a high 3.77V, 5.5dB greater than the CD standard's 2V. The output impedance at high and middle frequencies was low, at close to the specified 250 ohms, but rose to 955 ohms at the bottom of the audioband. The Lector's impulse response with 44.1kHz (fig.1) was usual for a digital FIR reconstruction filter, with symmetrical "ringing" either side of the impulse. The magenta and red traces in fig.2 reveal that while this filter rolls off the output sharply above the audioband with 44.1kHz data, it doesn't reach full attenuation until 2kHz or so above the Nyquist Frequency (half the sample rate, shown by the vertical green line). The image at 25kHz of a full-scale tone at 19.1kHz (cyan and blue traces) was therefore suppressed by 75dB, but this graph also shows fairly high levels of harmonic products, the second, at 38.2kHz, lying at –48dB (0.32%). The shape and level of the ultrasonic noise floor also appear to be signal dependent, with the left channel's floor higher than the right's.


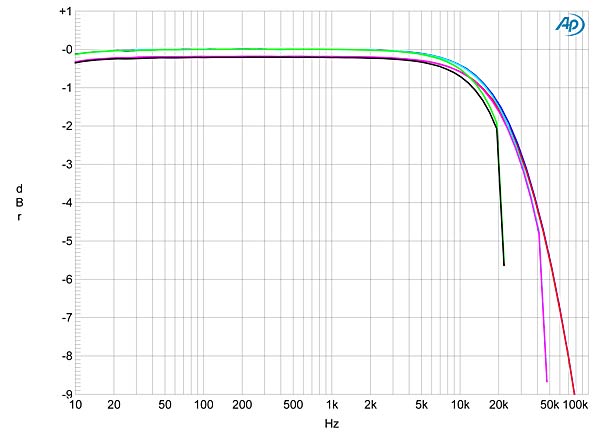


Fig.1 Lector Digitube S-192, impulse response with 44.1kHz sample rate.
Fig.2 Lector Digitube S-192, wideband spectrum of white noise at –4dBFS (left channel magenta, right red) and 19.1kHz tone at 0dBFS (left cyan, right blue), with data sampled at 44.1kHz (10dB/vertical div.).
Fig.3 shows a more conventional examination of the Digitube's frequency response, taken with spot tones at sample rates of 44.1kHz (green and gray traces), 96kHz (cyan, magenta), and 192kHz (blue, red). The response at each sample rate follows the same shape, with a gentle rolloff starting at around 10kHz and reaching –1.5dB at 20kHz, broken by a sharp drop just below each Nyquist frequency. Channel separation (fig.4) was disappointing, at 55dB in both directions at 20kHz, increasing to an acceptable 85dB at low frequencies.
Fig.3 Lector Digitube S-192, frequency response at –12dBFS into 100k ohms with data sampled at: 44.1kHz (left channel green, right gray), 96kHz (left cyan, right magenta), 192kHz (left blue, right red) (1dB/vertical div.).
Fig.4 Lector Digitube S-192, channel separation ref. 0dBFS: L–R (blue), R–L (red) (10dB/vertical div.).
My usual test for a digital processor's resolution is to feed it dithered data representing a 1kHz tone at –90dBFS and examine how much the noise floor drops when the bit depth of the data is increased from 16 to 24. However, with my usual FFT technique I got anomalous results (fig.5). While a small drop in the higher-frequency noise floor can be seen with 24-bit data (blue and red traces), the noise floor is polluted with low-level power-supply components, and the 24-bit traces are affected by high levels of odd-order harmonic products, these generally indicating truncation of the word length. In addition, the spectral spike at 1kHz is higher than the expected –90dBFS, suggesting some low-level compression. I repeated the spectral analysis with the older Audio Precision, sweeping a 1/3-octave bandpass filter from 20kHz down to 20Hz. The results are shown in fig.6: again, there is an error in absolute level, there is no significant increase in resolution with 24-bit data, and the right channel appears to suffer from word-length truncation.
Fig.5 Lector Digitube S-192, spectrum with noise and spuriae of dithered 1kHz tone at –90dBFS with: 16-bit data (left channel cyan, right magenta), 24-bit data (left blue, right red) (10dB/vertical div.).
Fig.6 Lector Digitube S-192, 1/3-octave spectrum with noise and spuriae of dithered 1kHz tone at –90dBFS with 16-bit data (left channel bottom at 20kHz) and 24-bit data (right channel bottom at 5kHz) (right channel dashed).
These days I don't usually publish plots of linearity error, as modern DACs are uniformly excellent in this regard. However, as can be seen in fig.7, the Lector D/A processor suffers from increasing linearity error below –75dB, and the smooth appearance of the trace suggests that this is actual level error rather than the effect of a random noise floor. For reference, fig.8 shows what an undithered 16-bit sinewave at exactly –90.31dBFS should look like: symmetrical about the time axis, with the three DC voltage levels described by the data clearly apparent. By contrast, fig.9 shows the Digitube's reproduction of this waveform: a noisy sinewave overlaid with positive- and negative-going spikes at the same frequency. Something is dreadfully wrong with the Digitube's handling of low-level data. Increasing the word length to 24 bits gave no change in the shape of the waveform other than the fact that the amplitude of the spikes was somewhat higher (not shown), suggesting that the Lector DAC is incapable of correctly handling 24-bit data.
Fig.7 Lector Digitube S-192, left-channel departure from linearity, 16-bit data (2dB/vertical div.).
Fig.8 MSB Analog DAC, waveform of undithered 1kHz sinewave at –90.31dBFS, 16-bit data (left channel blue, right red).
Fig.9 Lector Digitube S-192, waveform of undithered 1kHz sinewave at –90.31dBFS, 16-bit data (left channel blue, right red).
Fig.10 shows the spectrum of the Lector's output while it drove a full-scale 50Hz tone into 100k ohms. This is a high load, but even so, the second harmonic at 100Hz is fairly strong, at –50dB (0.3%), and a regular series of AC-supply components can be seen, the highest in level being 120Hz at –83dB. I experimented with every way of grounding the Digitube to both Audio Precision analyzers, but nothing changed the power-supply interference, which can also be seen in the spectrum of the Lector's output while it decoded 24-bit data representing a full-scale mix of 19 and 20kHz tones (fig.11). The left channel (blue trace) produces significantly more intermodulation than the right, but both of these graphs strongly suggest that the Digitube should not be used with preamplifiers having input impedances below 20k ohms.
Fig.10 Lector Digitube S-192, spectrum of 50Hz sinewave, DC–1kHz, at 0dBFS into 100k ohms (left channel blue, right red; linear frequency scale).
Fig.11 Lector Digitube S-192, HF intermodulation spectrum, DC–30kHz, 19+20kHz at 0dBFS into 100k ohms (left channel blue, right red; linear frequency scale).
I test for a digital processor's ability to reject word-clock jitter by feeding it undithered data representing the Miller-Dunn J-Test signal—a high-level tone at exactly 1/4 the sample rate accompanied by an LSB-level squarewave at 1/192 the sample rate—and performing narrowband spectral analysis of the resultant analog output signal. The result with 44.1kHz data should look like fig.12: a narrow spectral spike at 11.025kHz with a regular series of the odd-order harmonics of the low-frequency squarewave decreasing from left to right, their undistorted levels shown by the green line. By contrast, fig.13 shows the result for the Lector Digitube fed 16-bit S/PDIF data via TosLink. This is dreadful performance! Not only has a strong pair of sidebands appeared at the power-supply frequencies of 11.025Hz, ±120Hz, but all the odd harmonics have been increased in level, as has the overall noise floor. Repeating the analysis with 24-bit data produced no change in the picture, nor did repeating the test with USB data, which should be immune to word-clock jitter—the result was equally bad.
Fig.12 Sony HAP-Z1ES, high-resolution jitter spectrum of analog output signal, 11.025kHz at –6dBFS, sampled at 44.1kHz with LSB toggled at 229Hz: 16-bit internal data (left channel blue, right red). Center frequency of trace, 11.025kHz; frequency range, ±3.5kHz.
Fig.13 Lector Digitube S-192, high-resolution jitter spectrum of analog output signal, 11.025kHz at –6dBFS, sampled at 44.1kHz with LSB toggled at 229Hz: 16-bit data via TosLink from AP SYS2722 (left channel blue, right red). Center frequency of trace, 11.025kHz; frequency range, ±3.5kHz.
In the past year or so Stereophile has reviewed several superbly engineered D/A processors in the Lector's price class—from Arcam, Auralic, Ayre, Electrocompaniet, Marantz, and Musical Fidelity—as well as less expensive products that measure as well, from Benchmark and NAD. I know that Art Dudley wrote that he can "heartily recommend Lector Strumenti Audio's Digitube S-192 for the musicality it displayed in my system," and I have the utmost respect for AD's listening abilities. However, the Digitube's truly dreadful measured performance in the digital domain, along with its disappointing showing in the analog domain, rule it out of contention, in my opinion.—John Atkinson


