Sidebar 3: Measurements
I used DRA Labs' MLSSA system and a calibrated DPA 4006 microphone to measure the Legacy Studio HD's frequency response in the farfield, and an Earthworks QTC-40 for the nearfield responses. My estimate of the Studio HD's voltage sensitivity was 85.6dB/2.83V/m, slightly below the specified 86.5dB/2.83V/m.
The Legacy is specified as a 6 ohm load; with both its rear-panel toggle switches in the upward position, its impedance dropped below 6 ohms in the midbass and mid-treble, with a minimum magnitude of 2.64 ohms at 81Hz, and a demanding combination of 5 ohms and an electrical phase angle of –62.5° at 51Hz (fig.1). Though the impedance remains above 6 ohms for most of the treble and midrange, I think this speaker would work best with an amplifier that is comfortable driving 4 ohm loads. With the Trim switches flipped down, the impedance traces (fig.2) have the same basic shape as in fig.1, but now with a minimum value of 3.7 ohms at 76Hz, and the magnitude stays above 6 ohms for almost the entire audioband above 300Hz. However, there is still a combination of 5 ohms and an electrical phase angle of –52° at 54Hz.
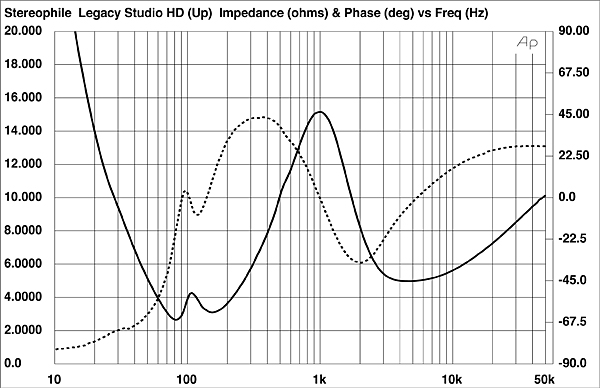

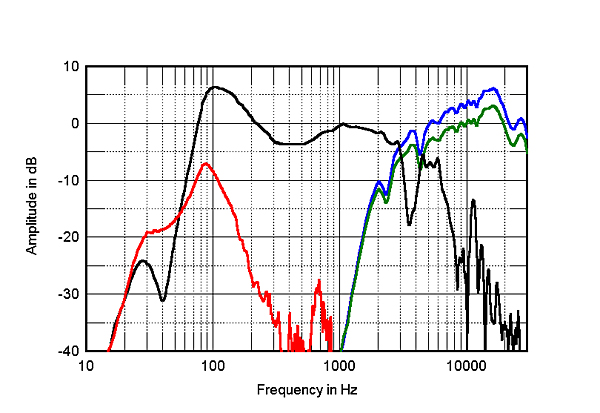
 Note the rise in impedance below 80Hz in fig.1. This rise, and the increasingly capacitive phase angle as the frequency drops, suggest that there is a capacitor in series with the woofer, presumably to protect it from subsonic overload below the port tuning frequency. The effect of this capacitor obscures the tuning frequency of the port that loads the woofer in fig.1; however, it looks as if the port is tuned to 80Hz, and the port's nearfield response (fig.4, red trace) does indeed peak sharply between 60 and 140Hz. Even so, the woofer's nearfield response (fig.4, black trace below 300Hz) has its minimum-motion notch (ie, when the back pressure from the port resonance holds the cone stationary) an octave lower, at 40Hz. The woofer's output also peaks sharply in the region covered by the port, and while some of this peak will be due to the nearfield measurement technique, which assumes that the drive-units are mounted in a baffle that extends to infinity in both planes, it does suggest an underdamped woofer alignment.
 The black trace below 300Hz in fig.5 shows the complex sum of the nearfield woofer and port outputs, taking into account amplitude, phase, and the different distances from a nominal farfield microphone position. I note that HR wrote that "the bottom octaves seemed shelved down"; the Studio HD's output does roll off very quickly below 80Hz, due to that series capacitor. And again, the broad peak in the upper bass is apparent. If the ear takes the upper-bass level as its reference with music, the midrange will sound depressed, which is what HR found: "the Studio HD . . . deemphasized the meaty part of the lower midrange." Above 300Hz, and averaged across a 30° horizontal window centered on the listening axis, the Legacy's response in fig.5 is uneven but relatively flat, other than the suppressed midrange and a rising treble in the top two octaves. All things being equal, this excess of on-axis, high-frequency energy will tend to balance the excessive upper bass.

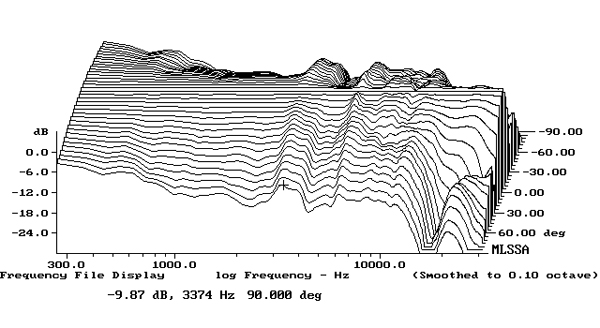


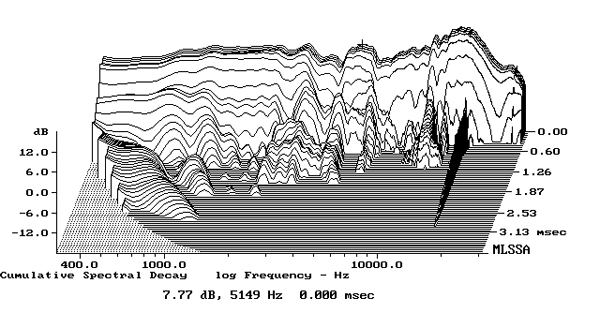
Fig.1 Legacy Studio HD with Trim switches up, electrical impedance (solid) and phase (dashed) (2 ohms/vertical div.).
Fig.2 Legacy Studio HD with Trim switches down, electrical impedance (solid) and phase (dashed) (2 ohms/vertical div.).
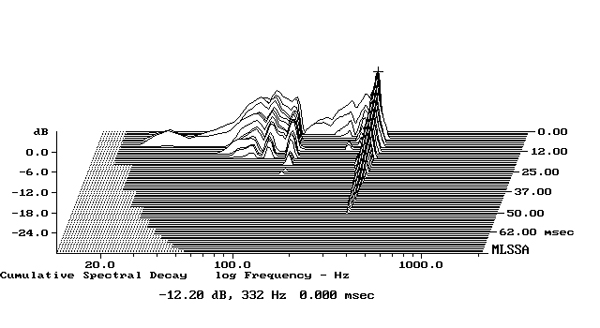
The traces in figs.1 & 2 are free from the small wrinkles that would imply the presence of cabinet-wall resonances. However, I did find a low-level mode at 332Hz on the sidewalls (fig.3). This is high enough in Q and frequency that it shouldn't add coloration, as HR indeed found.
Fig.3 Legacy Studio HD, cumulative spectral-decay plot calculated from output of accelerometer fastened to center of sidewall (MLS driving voltage to speaker, 7.55V; measurement bandwidth, 2kHz).
Fig.4 Legacy Studio HD, acoustic crossover on tweeter axis at 50", corrected for microphone response, with Treble switch up (blue) and down (green); and nearfield responses of woofer (black) and port (red), respectively plotted below 350 and 900Hz.
Higher in frequency in fig.4, the black trace above 350Hz shows the Studio HD woofer's farfield output on the tweeter axis. It starts to hand off to the tweeter above 2kHz, but what should be a smooth low-pass rolloff is broken by peaks and dips. The tweeter rolls in with a very steep 30dB/octave slope and has a gently rising response in its passband. The blue trace in fig.4 is the tweeter's output with the HF toggle up; the green trace is with this switch down—it can be seen that the switch reduces the tweeter's output by 3dB rather than the specified 2dB. The grille (not shown) reduces the Studio HD's output by between 1 and 2dB above 3kHz, but does so in an uneven manner. I left the grille off for all measurements shown in this review.
Fig.5 Legacy Studio HD, anechoic response on tweeter axis at 50", averaged across 30° horizontal window and corrected for microphone response, with complex sum of nearfield responses plotted below 300Hz.
The plot of the Studio HD's lateral dispersion, normalized to the tweeter-axis response (fig.6), reveals that the tweeter starts to become directional above 12kHz. Below the top octave, the Legacy's lateral dispersion features a lack of energy at the top of the woofer's passband, due to its relatively large diameter, with a much wider radiation pattern at the bottom of the tweeter's passband (fig.6, cursor position). I suspect that this behavior correlates with HR's finding that the Legacy emphasized the presence region. In the vertical plane (fig.7), suckouts develop in the crossover more than 5° above and 10° below the tweeter axis, and the output becomes very uneven. This speaker needs to be auditioned on the tweeter axis.
Fig.6 Legacy Studio HD, lateral response family at 50", normalized to response on tweeter axis, from back to front: differences in response 90–5° off axis, reference response, differences in response 5–90° off axis.
Fig.7 Legacy Studio HD, vertical response family at 50", normalized to response on tweeter axis, from back to front: differences in response 45–5° above axis, reference response, differences in response 5–45° below axis.
In the time domain, the Studio HD's step response on the tweeter axis (fig.8) shows that both drive-units are connected in positive acoustic polarity, with the tweeter's output arriving at the microphone before the woofer's. There is a reflection of the woofer's output 1 millisecond after the first arrival, which is associated with some slight delayed energy in the Legacy's cumulative spectral-decay plot (fig.9), and there are other ridges of delayed energy higher in level in the octaves above that frequency, these perhaps due to breakup modes in the woofer cone. However, the decay is otherwise clean over much of the midrange.
Fig.8 Legacy Studio HD, step response on tweeter axis at 50" (5ms time window, 30kHz bandwidth).
Fig.9 Legacy Studio HD, cumulative spectral-decay plot on tweeter axis at 50" (0.15ms risetime).
The Legacy HD's measured performance reveals it to be an idiosyncratic design. Its bass alignment has me puzzled, and I don't think a first-order low-pass crossover filter tames the woofer's out-of-band behavior effectively enough. But as HR found, the Studio HD can be made to boogie.—John Atkinson


