John Atkinson returned to the Marantz PM5003 in April 2010 (Vol.33 No.4):
In our January 2010 issue, Robert J. Reina enthused over the sound of this inexpensive 40Wpc integrated amplifier. For just $449.99, you get a relatively solidly constructed amp with remote control, a respectable moving-magnet phono stage, and a headphone output. "The Marantz PM5003 is a stunning achievement," Bob concluded: "an uncolored, revealing, well-built gem with more features than anyone could possibly ask for at the price."1
But a cloud overshadowed an otherwise rave review. When I examined the PM5003's measured performance, I found that while it behaved very respectably, with very low distortion, when its tone controls were in-circuit, deactivating them with the amplifier's Source Direct button significantly worsened the PM5003's linearity at levels over a couple of watts.
 Fig.1 Marantz PM5003, first sample, tone controls in-circuit but set to flat, distortion (%) vs 1kHz continuous output power into (from bottom to top): 8, 4 ohms.
Fig.1, for example, shows how the amplifier's THD+noise percentage varied with output power into loads of 8 and 4 ohms, using a 1kHz tone and the tone controls active but set to Flat. The decreasing level of THD+N with increasing power into both impedances indicates that the measurement is dominated by noise—a constant level of background noise becomes an increasingly smaller percentage of the output level as the latter increases. The actual distortion starts to rise above the noise only just below the actual point at which the waveform clips; ie, where the tops and bottoms begin to square. We formally define clipping as the point where there is 1% THD+N present, and you can see from fig.1 that the PM5003 clips at 42Wpc into 8 ohms (16.2dBW) and at 58Wpc into 4 ohms (14.6dBW), both figures a little higher than those specified.
Fig.1 Marantz PM5003, first sample, tone controls in-circuit but set to flat, distortion (%) vs 1kHz continuous output power into (from bottom to top): 8, 4 ohms.
Fig.1, for example, shows how the amplifier's THD+noise percentage varied with output power into loads of 8 and 4 ohms, using a 1kHz tone and the tone controls active but set to Flat. The decreasing level of THD+N with increasing power into both impedances indicates that the measurement is dominated by noise—a constant level of background noise becomes an increasingly smaller percentage of the output level as the latter increases. The actual distortion starts to rise above the noise only just below the actual point at which the waveform clips; ie, where the tops and bottoms begin to square. We formally define clipping as the point where there is 1% THD+N present, and you can see from fig.1 that the PM5003 clips at 42Wpc into 8 ohms (16.2dBW) and at 58Wpc into 4 ohms (14.6dBW), both figures a little higher than those specified.
 Fig.2 Marantz PM5003, first sample, Source Direct, distortion (%) vs 1kHz continuous output power into (from bottom to top below 1W): 8, 4 ohms.
By contrast, fig.2 shows the same measurement taken under identical conditions in Source Direct mode. The THD+N is the same as in fig.1, until 1.3W into 8 ohms and 2.6W into 4 ohms (both equivalent to an output voltage of 3.2V RMS), when there is a sudden, drastic rise in THD to just over 0.3%. This then drops a little before the amplifier reaches its actual clipping point.
Bob Reina reported hearing no difference between Source Direct mode and the active but centered tone controls. However, concerned by this disparity, which should not have existed, Marantz America sent a second sample, serial no. MZ000941001213. (The first sample's SN was MZ000841000471.) I reran the test procedure. The test conditions were identical, and I used the same combination of Audio Precision SYS2722 and Audio Precision System One Dual Domain analyzers.
Fig.2 Marantz PM5003, first sample, Source Direct, distortion (%) vs 1kHz continuous output power into (from bottom to top below 1W): 8, 4 ohms.
By contrast, fig.2 shows the same measurement taken under identical conditions in Source Direct mode. The THD+N is the same as in fig.1, until 1.3W into 8 ohms and 2.6W into 4 ohms (both equivalent to an output voltage of 3.2V RMS), when there is a sudden, drastic rise in THD to just over 0.3%. This then drops a little before the amplifier reaches its actual clipping point.
Bob Reina reported hearing no difference between Source Direct mode and the active but centered tone controls. However, concerned by this disparity, which should not have existed, Marantz America sent a second sample, serial no. MZ000941001213. (The first sample's SN was MZ000841000471.) I reran the test procedure. The test conditions were identical, and I used the same combination of Audio Precision SYS2722 and Audio Precision System One Dual Domain analyzers.
 Fig.3 Marantz PM5003, second sample, Source Direct, distortion (%) vs 1kHz continuous output power into (from bottom to top below 1W): 8, 4 ohms.
Fig.3 shows how the new sample's THD+N percentage, measured in Source Direct mode, behaved vs output power. As can be readily seen, it is basically identical to the original sample's behavior with the tone controls active (fig.1).
Fig.3 Marantz PM5003, second sample, Source Direct, distortion (%) vs 1kHz continuous output power into (from bottom to top below 1W): 8, 4 ohms.
Fig.3 shows how the new sample's THD+N percentage, measured in Source Direct mode, behaved vs output power. As can be readily seen, it is basically identical to the original sample's behavior with the tone controls active (fig.1).
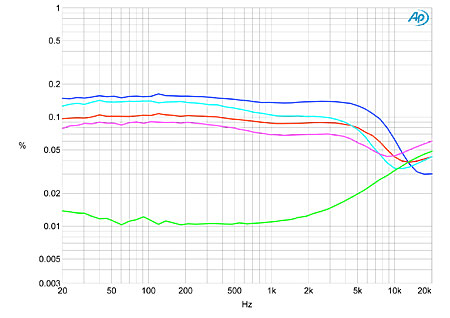 Fig.4 Marantz PM5003, first sample, tone controls in-circuit but set to flat, THD+N (%) vs frequency at 2.83V into: 8 ohms (left channel blue, right red), 4 ohms (left cyan, right magenta), 2 ohms (green).
 Fig.5 Marantz PM5003, second sample, Source Direct, THD+N (%) vs frequency at 2.83V into: 8 ohms (left channel blue, right red), 4 ohms (left cyan, right magenta), 2 ohms (green).
To confirm this, figs. 4 and 5 compare how the second sample's small-signal THD+N percentage varied with frequency with how the first sample behaved. The first sample (fig.4) showed a high level at all but the highest frequencies—except, to my puzzlement, into 2 ohms (green trace). By contrast, the second sample of the Marantz PM5003 (fig.5) offered very low THD+N at all frequencies, with the usual rise in the top octave resulting from the circuit's decrease in open-loop bandwidth at high frequencies, though this is not to any significant level.
Fig.5 Marantz PM5003, second sample, Source Direct, THD+N (%) vs frequency at 2.83V into: 8 ohms (left channel blue, right red), 4 ohms (left cyan, right magenta), 2 ohms (green).
To confirm this, figs. 4 and 5 compare how the second sample's small-signal THD+N percentage varied with frequency with how the first sample behaved. The first sample (fig.4) showed a high level at all but the highest frequencies—except, to my puzzlement, into 2 ohms (green trace). By contrast, the second sample of the Marantz PM5003 (fig.5) offered very low THD+N at all frequencies, with the usual rise in the top octave resulting from the circuit's decrease in open-loop bandwidth at high frequencies, though this is not to any significant level.
 Fig.6 Marantz PM5003, second sample, Source Direct, spectrum of 1kHz sinewave, DC–10kHz, at 30W into 8 ohms (left channel blue, right red; linear frequency scale).
Finally, fig.6 shows the spectrum of a low-frequency tone with the second sample operated close to clipping. By contrast with the first sample, which had both a relatively high level of second-harmonic distortion and visible power-supply harmonics in Source Direct mode, the second sample was much better in both respects.
As the second sample had a clean bill of health in Source Direct mode, any reservations about recommending the Marantz PM5003 can be eliminated. At $450, this amplifier is a best buy.—John Atkinson
Fig.6 Marantz PM5003, second sample, Source Direct, spectrum of 1kHz sinewave, DC–10kHz, at 30W into 8 ohms (left channel blue, right red; linear frequency scale).
Finally, fig.6 shows the spectrum of a low-frequency tone with the second sample operated close to clipping. By contrast with the first sample, which had both a relatively high level of second-harmonic distortion and visible power-supply harmonics in Source Direct mode, the second sample was much better in both respects.
As the second sample had a clean bill of health in Source Direct mode, any reservations about recommending the Marantz PM5003 can be eliminated. At $450, this amplifier is a best buy.—John Atkinson
Fig.1 Marantz PM5003, first sample, tone controls in-circuit but set to flat, distortion (%) vs 1kHz continuous output power into (from bottom to top): 8, 4 ohms.
Fig.2 Marantz PM5003, first sample, Source Direct, distortion (%) vs 1kHz continuous output power into (from bottom to top below 1W): 8, 4 ohms.
By contrast, fig.2 shows the same measurement taken under identical conditions in Source Direct mode. The THD+N is the same as in fig.1, until 1.3W into 8 ohms and 2.6W into 4 ohms (both equivalent to an output voltage of 3.2V RMS), when there is a sudden, drastic rise in THD to just over 0.3%. This then drops a little before the amplifier reaches its actual clipping point.
Fig.3 Marantz PM5003, second sample, Source Direct, distortion (%) vs 1kHz continuous output power into (from bottom to top below 1W): 8, 4 ohms.
Fig.3 shows how the new sample's THD+N percentage, measured in Source Direct mode, behaved vs output power. As can be readily seen, it is basically identical to the original sample's behavior with the tone controls active (fig.1).
Fig.4 Marantz PM5003, first sample, tone controls in-circuit but set to flat, THD+N (%) vs frequency at 2.83V into: 8 ohms (left channel blue, right red), 4 ohms (left cyan, right magenta), 2 ohms (green).
Fig.5 Marantz PM5003, second sample, Source Direct, THD+N (%) vs frequency at 2.83V into: 8 ohms (left channel blue, right red), 4 ohms (left cyan, right magenta), 2 ohms (green).
To confirm this, figs. 4 and 5 compare how the second sample's small-signal THD+N percentage varied with frequency with how the first sample behaved. The first sample (fig.4) showed a high level at all but the highest frequencies—except, to my puzzlement, into 2 ohms (green trace). By contrast, the second sample of the Marantz PM5003 (fig.5) offered very low THD+N at all frequencies, with the usual rise in the top octave resulting from the circuit's decrease in open-loop bandwidth at high frequencies, though this is not to any significant level.
Fig.6 Marantz PM5003, second sample, Source Direct, spectrum of 1kHz sinewave, DC–10kHz, at 30W into 8 ohms (left channel blue, right red; linear frequency scale).
Finally, fig.6 shows the spectrum of a low-frequency tone with the second sample operated close to clipping. By contrast with the first sample, which had both a relatively high level of second-harmonic distortion and visible power-supply harmonics in Source Direct mode, the second sample was much better in both respects.
As the second sample had a clean bill of health in Source Direct mode, any reservations about recommending the Marantz PM5003 can be eliminated. At $450, this amplifier is a best buy.—John Atkinson


