Sidebar 3: Measurements
I measured one of the Mark Levinson No.536 monoblocks (serial no.1250) with my Audio Precision SYS2722 system (see the January 2008 "As We See It"). Before doing any testing of a power amplifier, I precondition it by running it at one-third its specified power into 8 ohms for 60 minutes. (This power level results in the highest thermal stress on the output devices of an amplifier having a class-B or -AB output stage.) After an hour driving 133W into 8 ohms, the temperature of the No.536's heatsinks was fairly hot, at 114.8°F (46°C), and its top panel was warm, at 101.3°F (38.5°C).
The voltage gain into 8 ohms for both the balanced and unbalanced inputs was 25.6dB, and both inputs preserved absolute polarity, the XLR jack being wired with pin 2 hot. The input impedance at low and middle frequencies was extremely high, at 240k ohms 360k ohms balanced, and though at the top of the audioband this impedance dropped to 250k ohms balanced, these are still very high.
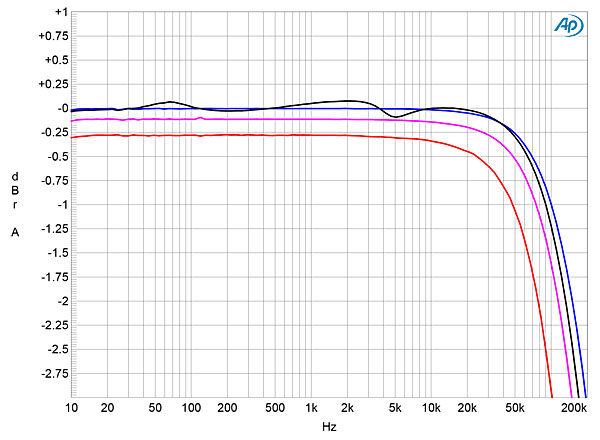
The output impedance was low, at 0.1 ohm at 20Hz and 1kHz, rising slightly to 0.13 ohm at 20kHz. The response with our standard simulated loudspeaker varied by just ±0.1dB (fig.1, gray trace). The amplifier offered a wide small-signal bandwidth, the output into 8 ohms (blue trace) not reaching –3dB until 195kHz. Consequently, the No.536's reproduction of a 10kHz squarewave (fig.2) featured very short risetimes and, commendably, no overshoot or ringing was apparent.

 The Mark Levinson is also an extremely powerful amplifier. With clipping defined as when the THD+noise reaches 1%, the No.536 clipped at 510W into 8 ohms (27.1dBW, fig.4), compared with the specified maximum output into 8 ohms of 400W (26dBW). It clipped at 800W into 4 ohms (26dBW, fig.5), and at 1050W into 2 ohms (24.2dBW). I don't hold the wall voltage constant in these clipping tests, as I feel that is more representative of how an amplifier behaves in normal use. The wall voltage at the 20A circuit that feeds my test lab dropped from 122.8V to 119.5V with the No.536 clipping into 4 ohms, and to 117V with it clipping into 2 ohms. With the wall voltage held constant, the amplifier would deliver even more power into very low impedances! The shape of the traces in these two graphs puzzled me: Although the level of THD+N is extremely low at low powers, it starts to rise earlier than I expected, and the amplifier appears to become more linear at moderately high powers before it starts to clip. I suspect that this behavior is due to there being only a moderate degree of negative feedback.

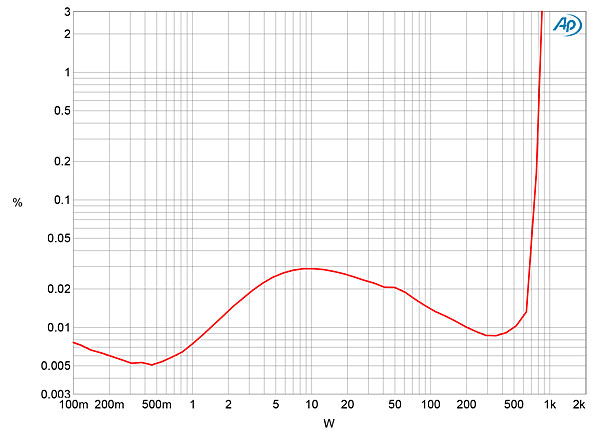
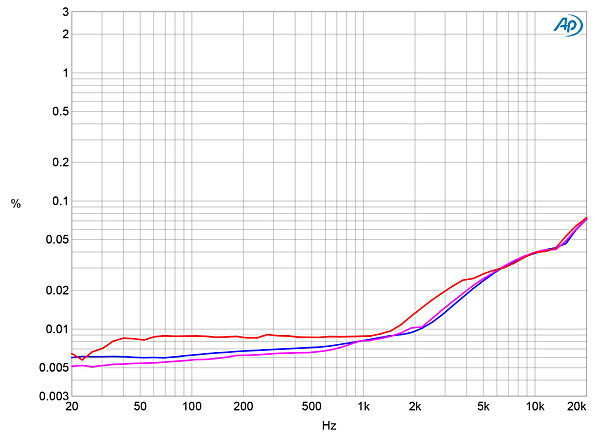
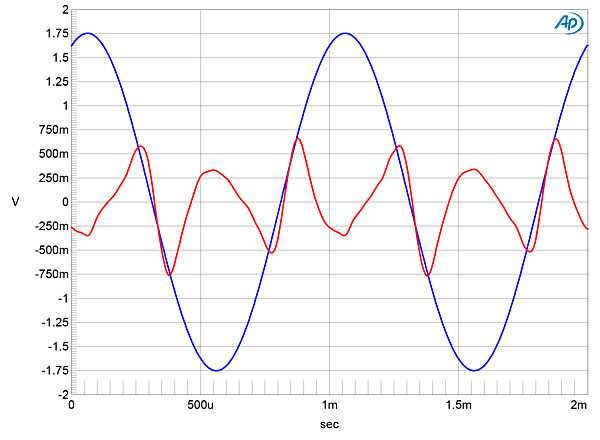
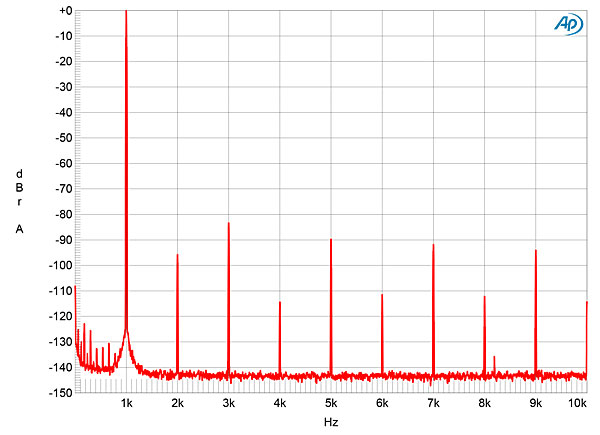
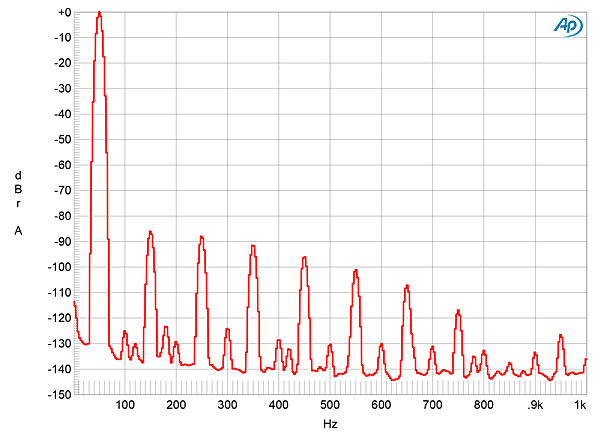
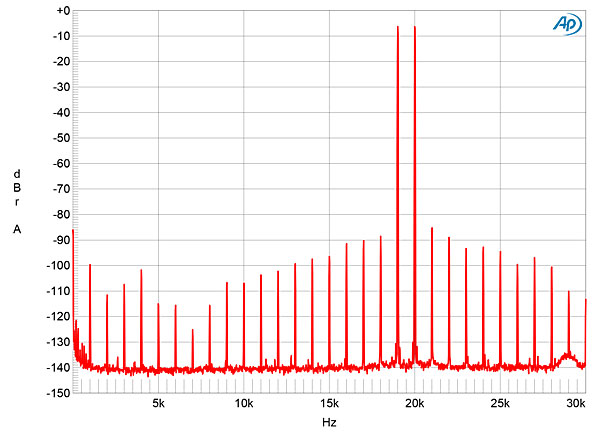
Fig.1 Mark Levinson No.536, frequency response at 2.83V into: simulated loudspeaker load (gray), 8 ohms (blue), 4 ohms (magenta), 2 ohms (red) (0.5dB/vertical div.).
Fig.2 Mark Levinson No.536, small-signal, 10kHz squarewave into 8 ohms.
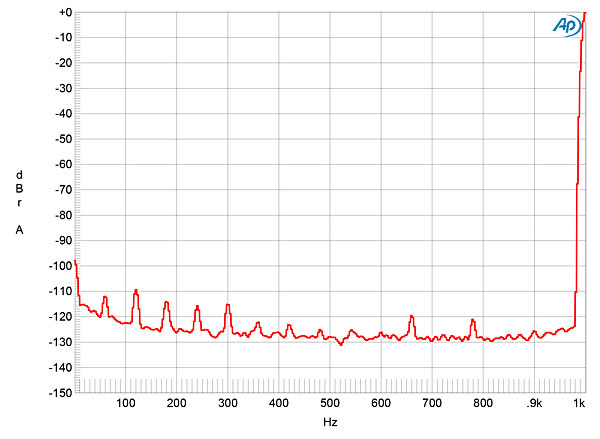
Measured with the input shorted to ground, the Mark Levinson amplifier offered a wideband, unweighted signal/noise ratio of 71dB, ref. 1W into 8 ohms. This improved to 96dB when the measurement bandwidth was restricted to 22Hz–22kHz, and to 99.3dB when the reading was A-weighted. This is a quiet amplifier, and while spectral analysis of its noise floor as it reproduced a 1kHz tone at 1W into 8 ohms (fig.3) revealed some supply-related spuriae, these were all at a very low level.
Fig.3 Mark Levinson No.536, spectrum of 1kHz sinewave, DC–1kHz, at 1W into 8 ohms (linear frequency scale).
Fig.4 Mark Levinson No.536, distortion (%) vs 1kHz continuous output power into 8 ohms.
Fig.5 Mark Levinson No.536, distortion (%) vs 1kHz continuous output power into 4 ohms.
The THD+N percentage at 28.3V—which is equivalent to 100W into 8 ohms, 200W into 4 ohms, and 400W into 2 ohms—was very low at low and middle frequencies (fig.6). Though the THD rises at frequencies above 2kHz, it still lies below 0.08% at 20kHz. With a 1kHz signal, the distortion signature is odd-order in nature (fig.7), with the second harmonic around 12dB lower in level than the third (fig.8). At low frequencies, however, the higher-order harmonics reach the same level as the third, and the even-order products disappear (fig.9). However, it is fair to note that all the distortion components lie at or below –86dB (0.005%). And while the mix of harmonics varies with frequency, it remains constant with output power, which some commentators feel correlates with good sound quality. When I tested the No.536 with an equal mix of 19 and 20kHz tones, the peak level equivalent to 200W into 4 ohms (fig.10), while some higher-order intermodulation products are visible, almost all lie below –90dB (0.003%), and the second-order difference product is at –100dB (0.001%).
Fig.6 Mark Levinson No.536, THD+N (%) vs frequency at 28.3V into: 8 ohms (blue), 4 ohms (magenta), 2 ohms (red).
Fig.7 Mark Levinson No.536, 1kHz waveform at 200W into 8 ohms, 0.013% THD+N (top); distortion and noise waveform with fundamental notched out (bottom, not to scale).
Fig.8 Mark Levinson No.536, spectrum of 1kHz sinewave, DC–10kHz, at 100W into 8 ohms (linear frequency scale).
Fig.9 Mark Levinson No.536, spectrum of 50Hz sinewave, DC–1kHz, at 100W into 8 ohms (linear frequency scale).
Fig.10 Mark Levinson No.536, HF intermodulation spectrum, DC–24kHz, 19+20kHz at 200W peak into 4 ohms (linear frequency scale).
Overall, the Mark Levinson No.536 measured very well, its performance uncompromised by its ability to deliver very high powers into low-impedance loads.—John Atkinson


