Sidebar 4: Measurements
I performed the measurements of the Mastersound Compact 845 amplifier with my Audio Precision SYS2722 system. The tubes were installed when I received the review sample, and I waited for an hour after powering up the amplifier before starting the testing. The Mastersound runs hot—after an hour the temperature of the top panel in front of the line-stage tubes was 115.9°F/46.6°C.
The Compact 845 inverted polarity from both the 4 ohm and 8 ohm output transformer taps with the balanced and single-ended inputs but preserved absolute polarity from its Direct inputs, which bypass the preamplifier stage and volume control. The voltage gain at 1kHz from the unbalanced Direct inputs was 23.1dB from the 8 ohm tap and 20.7dB from the 4 ohm tap, both figures into 8 ohms. From the regular inputs, the gain into 8 ohms from the 8 ohm tap with the volume control set to its maximum was 32dB, balanced, and 36.55dB, unbalanced. The maximum gains from the 4 ohm tap were both 2.3dB lower.
The input impedance is specified as a high 50k ohms. For the single-ended Direct input, I measured 33k ohms at 20Hz and 1kHz, and 28.6k ohms at 20kHz. The normal unbalanced input's impedance varied from a high 71k ohms at 20Hz to 52.6k ohms at 20kHz; the balanced input impedance was much lower, at 3230 ohms across the audioband.
The Compact 845's channel separation (not shown) was relatively poor, at 50dB in both directions below 1kHz, decreasing to 30dB at the top of the audioband. I monitored the waveform on an oscilloscope when I performed this measurement, which indicated that I was measuring true crosstalk rather than noise. The Mastersound amplifier's output had a relatively low level of noise. The unweighted, wideband signal/noise ratio (ref. 1W into 8 ohms), taken from the 8 ohm taps with the inputs shorted to ground and the volume control set to its maximum, was 67.6dB (average of the two channels). This ratio improved slightly to 68.5dB when the measurement bandwidth was restricted to 22Hz–22kHz, and to 78.9dB when A-weighted. With their lower gain, the ratios from the 4 ohm outputs were 2dB greater.
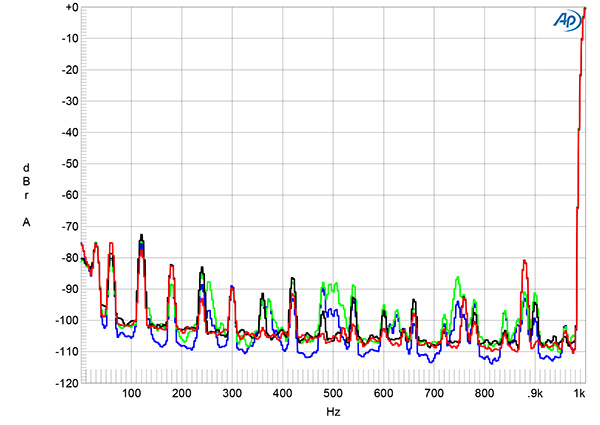

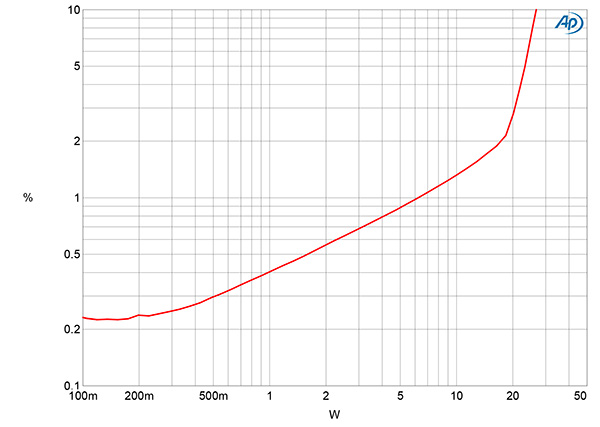


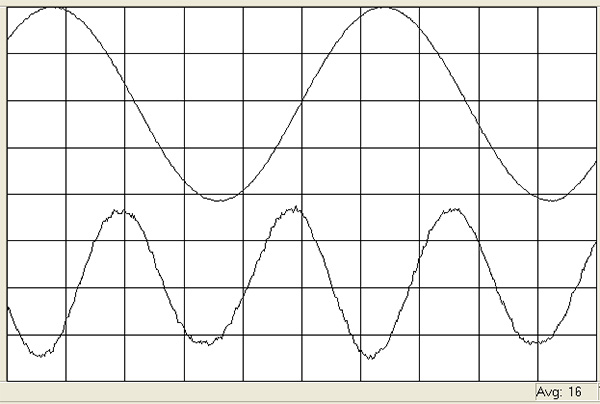
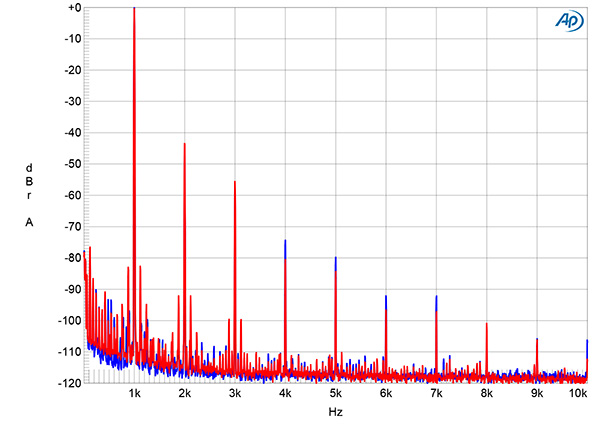

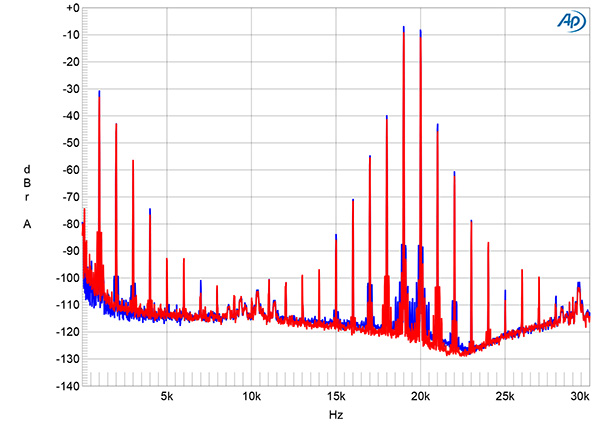
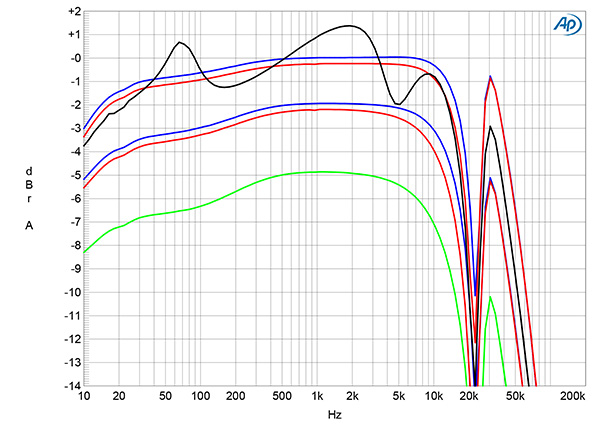
Fig.1 Mastersound 845 Compact, 8 ohm output tap, frequency response at 2.83V into: simulated loudspeaker load (gray), 8 ohms (left channel blue, right red), 4 ohms (left cyan, right magenta), and 2 ohms (green) (1dB/vertical div.).
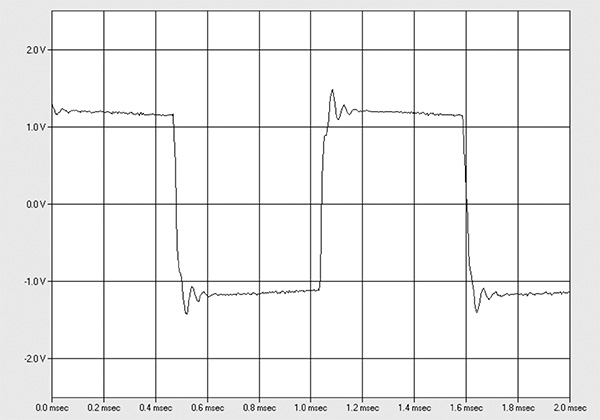
Fig.2 Mastersound 845 Compact, 8 ohm output tap, small-signal 1kHz squarewave into 8 ohms.
The source impedance from the 8 ohm output tap was a high 3.5 ohms at 20Hz, 2.6 ohms at 1kHz, and 7.3 ohms at 20kHz. The variation in the small-signal frequency response with this output with our standard simulated loudspeaker (fig.1, gray trace) was therefore moderately high, at ±1.7dB. The 4 ohm tap's source impedance was lower, at 1.7 ohms at 20Hz, 1.3 ohms at 1kHz, and 3.15 ohms at 20kHz, which meant that the response variation with the simulated speaker was lower, at ±1dB. However, there will be audible modifictions of loudspeaker responses with both output taps. Into resistive loads (fig.1, blue, red, cyan, magenta, and green traces), the Mastersound amplifier's 8 ohm output shelved down below 40Hz and rolled off above 10kHz, reaching –3dB at 18kHz. A sharply defined response peak at 30kHz correlates with overshoot and ringing in the amplifier's reproduction of a 1kHz squarewave into 8 ohms (fig.2). This peak was higher in amplitude with higher load impedances and from the 4 ohm output transformer tap.
Fig.1 was taken with the volume control set to its maximum; the left channel is 0.26dB higher in level at 1kHz than the right. This difference increased to 0.46dB when I repeated the measurement with the volume control set to –20dB, though the response was otherwise identical.
Something I noticed while doing these tests was that the Compact 845 emitted audible sounds (above), which seemed to be coming from the output tube circuitry rather than the transformers. While the level wasn't very high—the spl in front of the amplifier was 66dB(C), slow ballistics, with the amplifier driving 1kHz at 1Wpc into 8 ohms—it was still readily audible and was not masked by the NPR news playing on a nearby portable radio in the test lab.
Fig.3 Mastersound 845 Compact, 8 ohm output tap, spectrum of 1kHz sinewave, DC–1kHz, at 1Wpc into 8 ohms with volume control set to its maximum (left channel green, right gray) and to –20dB (left blue, right red) (linear frequency scale).
Spectral analysis of the low-frequency noisefloor while the Mastersound's 8 ohm taps drove a 1kHz tone at 1Wpc into 8 ohms with the volume control set to the maximum (fig.3, left channel green, right gray) revealed a low level of random noise. However, AC supply–related spuriae at 60Hz and its odd- and even-order harmonics were present, and their levels didn't change when I experimented with the grounding between the amplifier and the Audio Precision analyzer. The highest of these spuriae, at 120Hz, lay at –73dB (0.02%). Repeating the analysis with the volume control set to –20dB (blue, red traces) lowered the levels of the power supply–related spuriae by up to 6dB, but the random noisefloor's level didn't change.
Fig.4 Mastersound 845 Compact, 8 ohm output tap, distortion (%) vs 1kHz continuous output power into 8 ohms.
Fig.5 Mastersound 845 Compact, 4 ohm output tap, distortion (%) vs 1kHz continuous output power into 4 ohms.
Mastersound specifies the Compact 845's maximum power as 30W, which is equivalent to 14.76dBW into 8 ohms and 11.76dBW into 4 ohms. According to Stereophile's usual definition of clipping, when THD+N reaches 1%, the amplifier didn't get close to that power. With both channels driven, I measured a clipping power of 11.5Wpc from the 8 ohm tap into 8 ohms (10.6dBW, fig.4) and 6.9Wpc from the 4 ohm tap into 4 ohms (5.4dBW, fig.5). Raising the clipping limit to 3% THD+N, I measured 22Wpc with each output tap matched to the load. At 10% THD+N, the Compact 845 approaches its specified power.
Fig.6 Mastersound 845 Compact, 4 ohm output tap, distortion (%) vs 1kHz continuous output power into 8 ohms.
Tube amplifiers usually have less distortion when the load impedance is greater than the nominal output transformer impedance. As revealed in fig.6, which plots the THD+N percentage against output power with the 4 ohm tap driving 8 ohms, the Mastersound's THD+N was higher with a larger load impedance, not lower. At 3% THD+N, the 4 ohm tap was putting out 10Wpc into 8 ohms.
Fig.7 Mastersound 845 Compact, 8 ohm output tap, THD+N (%) vs frequency at 4.9V into: 8 ohms (left channel blue, right red), 4 ohms (left green, right gray).
Fig.7 shows how the percentage of THD+N in both channels varied with frequency, with the 8 ohm tap driving 8 and 4 ohms at 4.9V, which is equivalent to 3W into 8 ohms and 6W into 4 ohms. The huge rise in distortion above 10kHz may well be due to the high-frequency rolloff in this region and, perhaps, to the fact that the distortion is being magnified by the output transformer resonance seen in fig.1. The THD+N rose slightly at low frequencies and was higher into 4 ohms (green and gray traces) than it was into 8 ohms (blue and red traces). At the same voltage from the 4 ohm tap (not shown), the distortion in the midrange and treble was close to 0.6% into 4 ohms and 1% into 8 ohms.
Fig.8 Mastersound 845 Compact, 8 ohm output tap, left channel, 1kHz waveform at 1W into 8 ohms, 0.29% THD+N (top); distortion and noise waveform with fundamental notched out (bottom, not to scale).
Fig.9 Mastersound 845 Compact, 8 ohm output tap, spectrum of 1kHz sinewave, DC–10kHz, at 3Wpc into 8 ohms (left channel blue, right red; linear frequency scale).
Fig.10 Mastersound 845 Compact, 8 ohm output tap, spectrum of 50Hz sinewave, DC–1kHz, at 3Wpc into 8 ohms (left channel blue, right red; linear frequency scale).
Fortunately, as fig.8 shows, the distortion was predominantly the (arguably innocuous) second harmonic, with higher-order harmonics progressively lower in level (fig.9). However, at low frequencies (fig.10), the level of the third harmonic was the same as the second, perhaps indicating the onset of core saturation in the output transformers.
Fig.11 Mastersound 845 Compact, 8 ohm output tap, HF intermodulation spectrum, DC–30kHz, 19+20kHz at 3Wpc peak into 8 ohms (left channel blue, right red; linear frequency scale).
Due to the masking, the level of the second harmonic may not result in audible distortion with music, as long as it is not accompanied by intermodulation distortion. With the Compact 845's 8 ohm taps driving an equal mix of 19 and 20kHz tones at 3Wpc peak into 8 ohms (fig.11), the 1kHz difference product lay at –30dB (0.3%), and many higher-order intermodulation products were present. This behavior correlates with the increase in THD+N in the top audio octave seen in fig.7. The amplifier may well sound better than this test suggests, since top-octave energy level is typically lower in music than in test tones. However, this information is presented here, as it is with every review, since we standardized on this intermodulation test when we started measuring amplifiers three decades ago.
Other than the differences caused by different output tubes—the 845 tube is capable of putting out more power than the 300B—these results are very similar to those measured in the Mastersound 300 B S.E. integrated amplifier, which Art Dudley reviewed in March 2008. The high levels of distortion and the high source impedances will be due to the single-ended triode topology and the decision not to use loop negative feedback. I concluded my discussion of the 300 B S.E. measurements by asking whether the reviewer liked the amplifier because of what it did right despite what it did wrong, or because of what it did wrong. In 2008, I didn't have an answer to that question. I still don't.—John Atkinson


