Sidebar 3: Measurements
I measured the C 3050 LE using my Audio Precision SYS2722 system. As the NAD is a class-D design, I didn't precondition the amplifier by driving a 1kHz tone at one-third power into 8 ohms. Nevertheless, before doing any testing, I ran it for an hour at a moderate power level to ensure that it was fully warmed up. At the end of that time, the temperature of the black grille on the top panel was 92.1°F/33.4°C. Because class-D amplifiers emit relatively high levels of ultrasonic noise that would drive my analyzer's input into slew-rate limiting, all the measurements other than frequency response were taken with Audio Precision's auxiliary AUX-0025 passive low-pass filter, which eliminates noise above 250kHz. Without the filter, 294mV of ultrasonic noise with a center frequency of 413kHz was present at the loudspeaker terminals. This noise was also present, at a much lower level, at the headphone output.
Looking first at the analog line input: With the NAD's volume control set to its maximum, the tone controls active but set to do nothing, the voltage gain at 1kHz into 8 ohms measured a relatively low 29dB from the speaker terminals, 4.2dB from the headphone output, and –0.07dB from the preamplifier output. The line input preserved absolute polarity (ie, was noninverting) from all three output types, and the input impedance was close to the specified 28k ohms at 27k ohms at low and middle frequencies, dropping to 23.6k ohms at 20kHz. The power amplifier input impedance was 50k ohms at 20Hz and 1kHz, 26k ohms at 20kHz, with a voltage gain into 8 ohms of 29dB.


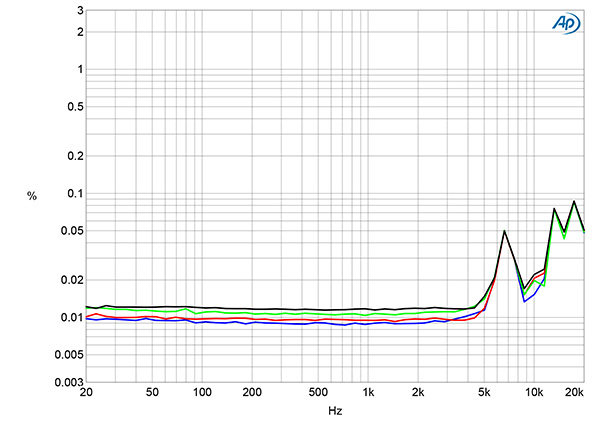


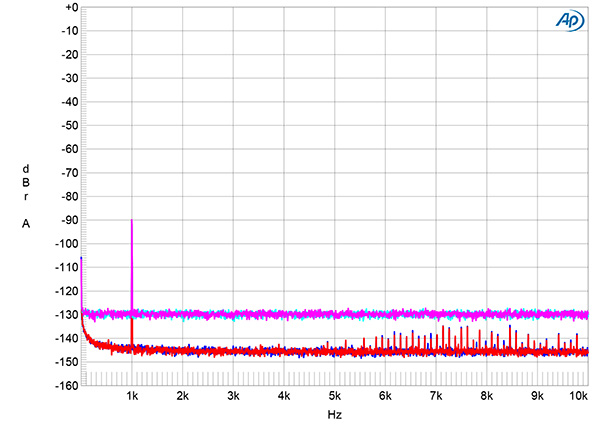


Fig.1 NAD C3050 LE, line input, frequency response at 2.83V into: simulated loudspeaker load (gray), 8 ohms (left channel blue, right red), 4 ohms (left cyan, right magenta), 2 ohms (green) (0.5dB/vertical div.).
Fig.2 NAD C3050 LE, line input, small-signal, 1kHz squarewave into 8 ohms.
The preamplifier's output impedance was 433 ohms from 20Hz to 20kHz; the impedance at the headphone output was 11 ohms, again from 20Hz to 20kHz. The C 3050 LE's output impedance at the speaker terminals was very low, at 0.09 ohm at 20Hz and 1kHz, 0.1 ohm at 20kHz. (These values include the series resistance of 6' of spaced-pair speaker cable.) Consequently, the variation in frequency response with our standard simulated loudspeaker (fig.1, gray trace) is minimal. The traces in fig.1 cut off sharply above 20kHz, due to the C 3050 LE converting its line input to digital. The C 3050 LE's reproduction of an analog 1kHz squarewave had the ringing on its leading and trailing edges that are typical of a linear-phase reconstruction filter (fig.2), and a 10kHz squarewave was reproduced as a sinewave, due to the odd-order harmonics that would give the wave its square shape being removed by the A/D converter's antialiasing filter.
Fig.3 NAD C3050 LE, line input, frequency response at 2.83V into 8 ohms with Bass and Treble controls set to "0dB," "+6dB," and "–6dB" (left channel blue, right red) (1dB/vertical div.).
Fig.3 shows the effect of the NAD's bass and treble controls set to their +6dB and –6dB positions. The bass control offers a range of +6.5dB/–5.5dB below 50Hz, the treble control +5.7dB/–5.2dB at 20kHz. Channel separation was good rather than great, at >70dB in both directions below 1kHz decreasing to 49dB at 20kHz.
Fig.4 NAD C3050 LE, line input, spectrum of 1kHz sinewave, DC–1kHz, at 1W into 8 ohms (left channel blue, right red; linear frequency scale).
With the Audio Precision ultrasonic filter, the line inputs shorted to ground, and the volume control set to its maximum, the wideband, unweighted signal/noise ratio (ref. 2.83V into 8 ohms) measured a good 72.1dB in both channels. Restricting the measurement bandwidth to 22kHz increased the ratio to 75dB, and an A-weighting filter increased it further, to 77.4dB. Spectral analysis of the NAD's low-frequency noisefloor (fig.4) revealed no spuriae related to AC power.
Fig.5 NAD C3050 LE, line input, distortion (%) vs 1kHz continuous output power into 8 ohms.
Fig.6 NAD C3050 LE, line input, distortion (%) vs 1kHz continuous output power into 4 ohms.
Fig.7 NAD C3050 LE, THD+N (%) vs frequency at 12.65V into: 8 ohms (left channel blue, right red), and 4 ohms (left cyan, right magenta).
The C 3050 LE is specified as delivering a maximum continuous output power of 100Wpc into 8 ohms (20dBW). At our usual definition of clipping (ie, when the percentage of THD+noise in the amplifier's output reaches 1%), with continuous drive, the C 3050 LE clipped at 106Wpc into 8 ohms (20.25dBW, fig.5) and at 155Wpc into 4 ohms (18.9dBW, fig.6). Distortion levels at moderate powers (fig.7) were very low, though with an increase in the top two octaves.
Fig.8 NAD C3050 LE, line input, 1kHz waveform at 10W into 8 ohms, 0.032% THD+N (top); distortion and noise waveform with fundamental notched out (bottom, not to scale).
Fig.9 NAD C3050 LE, line input, spectrum of 50Hz sinewave, DC–1kHz, at 20Wpc into 8 ohms (left channel blue, right red; linear frequency scale).
Fig.10 NAD C3050 LE, line input, HF intermodulation spectrum, DC–30kHz, 19+20kHz at 40Wpc peak into 4 ohms (left channel blue, right red; linear frequency scale).
The shape of the THD+N spuriae waveform at 10Wpc into 8 ohms (fig.8, bottom trace) is obscured by high-frequency noise, even with the Audio Precision filter, but the distortion signature appears to be primarily third-harmonic in nature. This was confirmed by spectral analysis (fig.9), with the second harmonic 10dB lower in level. Intermodulation distortion was very low, even into 4 ohms (fig.10), though the digitization of this input led to aliasing products at 28kHz and 29kHz. These frequencies suggest that the A/D converter operates at a sample rate of 48kHz.
Fig.11 NAD C3050 LE, phono input, response with RIAA correction (left channel blue, right red) (0.5dB/vertical div.).
Turning to the NAD's MM-compatible phono input, I connected a wire from the Audio Precision's ground terminal to the grounding lug on the NAD's rear panel to obtain the lowest noise. This input preserved absolute polarity at all three outputs. The phono input's RIAA correction was superbly accurate (fig.11), though it cut off sharply above 21kHz due to the input being digitized. The input impedance measured 45k ohms at 20Hz and 1kHz, dropping slightly to 34k ohms at 20kHz. The maximum gain at 1kHz was 33.6dB at the Pre output, 38.7dB at the headphone output, and 62.55dB at the loudspeaker outputs. To avoid clipping the power amplifier stage, I turned off the speaker outputs, removed the pre/power jumpers, and performed all the subsequent testing using the preamp output.
Fig.12 NAD C3050 LE, phono input, spectrum of 1kHz sinewave, DC–1kHz, for 5mV input (left channel blue, right red, linear frequency scale).
The wideband, unweighted S/N ratio with the inputs shorted to ground and the volume control set to the maximum was a very good 64.7dB in both channels, ref. 1kHz at 5mV. Restricting the measurement bandwidth to the audioband increased the ratio to 71dB, while an A-weighting filter further increased the ratio to 78.9dB. Spectral analysis of the phono input's low-frequency noisefloor (fig.12) revealed very low levels of random noise and no power supply–related spuriae.
Fig.13 NAD C3050 LE, phono input, spectrum of 1kHz sinewave, DC–10kHz, for 20mV input (left channel blue, right red, linear frequency scale).
Fig.14 NAD C3050 LE, phono input, spectrum of 19 and 20kHz sinewaves, DC–30kHz, for 200mV input (left channel blue, right red, linear frequency scale).
The phono input's overload margins ref. 1kHz at 5mV were usefully high, at 19.3dB from 20Hz to 20kHz. The phono input's distortion signature was an equal mix of second and third harmonics, both lying at a very low –100dB (0.001%) with 1kHz at an input level of 20mV (fig.13). The level of the 1kHz difference product with an equal mix of 19 and 20kHz tones was also very low, at –100dB (0.001%, fig.14).
To examine the performance of the C 3050 LE's digital inputs, I used the Audio Precision's optical and coaxial S/PDIF outputs and data sent to the C 3050 LE over my network using BluOS. I saw no significant differences among the data sources. Both S/PDIF inputs locked to datastreams with all sample rates up to 192kHz.
With the volume control set to its maximum, a 1kHz digital signal at –20dBFS resulted in an output level of 5.97V into 8 ohms from the loudspeaker output, which is 13.76dB below the clipping level. A signal at 0dBFS gave levels of 3.45V from the headphone output and 2.13V from the preamplifier output. As with the phono input testing, I measured the digital inputs' behavior at the preamplifier output with the speaker outputs turned off.
Fig.15 NAD C3050 LE, digital input, impulse response (one sample at 0dBFS, 44.1kHz sampling, 4ms time window).
Fig.16 NAD C3050 LE, digital input, wideband spectrum of white noise at –4dBFS (left channel red, right magenta) and 19.1kHz tone at 0dBFS (left blue, right cyan), with data sampled at 44.1kHz (20dB/vertical div.).
The NAD's impulse response with 44.1kHz data (fig.15) indicates that the reconstruction filter is a conventional linear-phase type, with time-symmetrical ringing on either side of the single sample at 0dBFS. With 44.1kHz-sampled white noise (fig.16, red and magenta traces), the C 3050 LE's response rolled off sharply above 20kHz, reaching full stop-band suppression at 24kHz, though some low-level scalloping of the ultrasonic noisefloor is present. An aliased image at 25kHz of a full-scale tone at 19.1kHz (blue and cyan traces) can be seen at –70dB, and distortion harmonics of the 19.1kHz tone are visible above the ultrasonic noisefloor, the third harmonic being the highest in level at –67dB (0.04%).
Fig.17 NAD C3050 LE, digital input, frequency response with data sampled at 44.1kHz (left channel green, right gray), 96kHz (left cyan, right magenta), 192kHz (left blue, right red) (20dB/vertical div.).
Fig.18 NAD C3050 LE, digital input, spectrum with noise and spuriae of dithered 1kHz tone at –90dBFS with: 16-bit data (left channel cyan, right magenta), 24-bit data (left blue, right red) (20dB/vertical div.).
When I examined the NAD's frequency response with S/PDIF data at 44.1, 96, and 192kHz, the response at all three rates dropped off sharply just below half of each sample rate (fig.17). Increasing the bit depth from 16 to 24 with a dithered 1kHz tone at –90dBFS lowered the noisefloor by 15dB (fig.18), meaning that the C 3050 LE offers between 18 and 19 bits of resolution. With undithered data representing a tone at exactly –90.31dBFS (not shown), the three DC voltage levels described by the data were well resolved and the waveform was perfectly symmetrical. With undithered 24-bit data, the result was a clean sinewave (also not shown).
Fig.19 NAD C3050 LE, digital input, HF intermodulation spectrum, DC–30kHz, 19+20kHz at 0dBFS peak, sampled at 44.1kHz.
The second-order intermodulation product at 1kHz with an equal mix of 19 and 20kHz tones with a peak level of 0dBFS lay at a low –97dB (0.0014%, fig.19), though the higher-order products at 18kHz and 21kHz were 20dB higher in level. The aliased images of the primary tones are present at 24kHz and 25.1kHz.
Fig.20 NAD C3050 LE, digital input, high-resolution jitter spectrum of analog output signal, 11.025kHz at –6dBFS, sampled at 44.1kHz with LSB toggled at 229Hz: 16-bit TosLink data (left channel blue, right red). Center frequency of trace, 11.025kHz; frequency range, ±3.5kHz.
Fig.21 NAD C3050 LE, digital input, high-resolution jitter spectrum of analog output signal, 11.025kHz at –6dBFS, sampled at 44.1kHz with LSB toggled at 229Hz: 16-bit network data (left channel blue, right red). Center frequency of trace, 11.025kHz; frequency range, ±3.5kHz.
The NAD's rejection of word-clock jitter with 16-bit TosLink data (fig.20) was superb, with all the odd-order harmonics of the LSB-level, low-frequency squarewave at the correct levels, indicated by the sloping green line in this graph. However, the spectral spike that represents the high-level tone at one-quarter the sample rate is broadened at its base due to the presence of low-frequency random noise jitter. Repeating the analysis with 16-bit network data (fig.21) reduced the level of this random jitter.
Like NAD's M10, the C 3050 LE offers excellent measured performance overall.—John Atkinson


