Sidebar 3: Measurements
I performed a full set of measurements on the Pass Laboratories INT-60 using my Audio Precision SYS2722 system (see the January 2008 "As We See It"). I preconditioned the amplifier by running it with both channels driven at one-third power into 8 ohms for 60 minutes. This is, thermally, the worst situation for an amplifier with a class-B or -AB output stage, as one-third power is when the output transistors dissipate the most heat. At the end of the hour, the highest temperature on the side-mounted heatsinks was 114.7°F (45.9°C), and that on the top panel, which was highest toward the rear, was 107.1°F (41.8°C). The THD+noise measured a constant 0.084% throughout this hour.
The volume control operated in accurate 1dB steps, and the voltage gain into 8 ohms with the volume control set to its maximum measured 28.6dB for both balanced and unbalanced input signals. Both inputs preserved absolute polarity (ie, were non-inverting). The input impedance was usefully high, measuring 90k ohms balanced and 75k ohms unbalanced at low and middle frequencies. The impedance dropped slightly at the top of the audioband, to 80k ohms balanced and 34k ohms unbalanced, but these are still high in absolute terms.
Overall, the INT-60's measured performance suggested that its circuit uses a modest amount of negative feedback, so I wasn't surprised to find that its output impedance was relatively high for a solid-state design: 0.16 ohm at 20Hz and 1kHz, rising to 0.35 ohm at 20kHz (both figures include 10' of speaker cable). Nevertheless, the modulation of the amplifier's frequency response into our standard simulated loudspeaker was fairly low, at ±0.18dB (fig.1, gray trace). Pass Labs specifies the INT-60's frequency response as being down by 6dB at 80kHz. Fig.1 confirms that figure, there being a reduction in output of just 0.25dB at 20kHz. The shape of a 10kHz squarewave into 8 ohms (fig.2) had slightly slowed risetimes, but with commendable absences of overshoot and ringing. Figs. 1 and 2 were taken with the volume control set to its maximum of "63"; there was no difference in the performance with the control set to "40," and the excellent channel matching seen in fig.1 was maintained at the lower setting.


 The INT-60 is specified as delivering 60Wpc into 8 ohms (17.8dBW) at 1% THD+N; as shown in fig.4, our sample clipped at 79Wpc with both channels driven into that load (19dBW). The distortion begins to rise out of the noise at around 2W, and the gentle rise in THD+N above that power suggests that only a modest degree of negative feedback is used. Into 4 ohms (fig.5), the amplifier clipped at 125W (18dBW), a slightly higher power than the specified 120Wpc, while with one channel driven into 2 ohms (fig.6), the INT-60 clipped at 200W (17dBW).


 At low frequencies, the predominant distortion harmonic is the subjectively benign second (fig.8), though at 1kHz, the third harmonic rises higher in level than the second (figs. 9 and 10). Despite the increase in its harmonic distortion in the top octave, the INT-60 did relatively well on the punishing high-frequency intermodulation test, even at a fairly high power into 4 ohms (fig.11). The second-order or difference component resulting from an equal mix of 19 and 20kHz tones lies at a respectably low –67dB (0.04%), though the higher-order components at 19 and 21kHz are a little higher in level, at –60dB (0.1%).


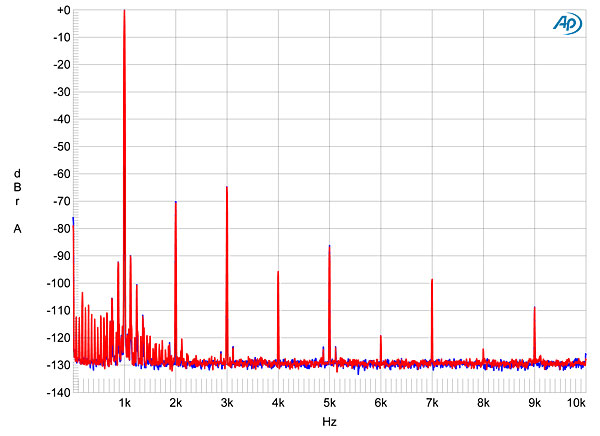

Fig.1 Pass Labs INT-60, frequency response with volume control set to its maximum at 2.83V into: simulated loudspeaker load (gray), 8 ohms (left channel blue, right red), 4 ohms (left cyan, right magenta), 2 ohms (green) (0.5dB/vertical div.).
Fig.2 Pass Labs INT-60, small-signal, 10kHz squarewave into 8 ohms.
Channel separation at 1kHz was excellent, at 96dB R–L and 104dB L–R, and at 20kHz was still, respectively, 80 and 87dB. The unweighted, wideband signal/noise ratio (ref. 2.83V into 8 ohms, 1W), taken with the input shorted to ground but the volume control set to "63," was 76.5dB. This increased to 84dB with an A-weighting filter; spectral analysis of the low-frequency noise floor while the INT-60 drove a 1kHz tone at 1W into 8 ohms revealed the presence of some low-level, supply-related spuriae (fig.3). These were not affected when I experimented with the ground connection between the INT-60 and the Audio Precision test system. Those spuriae at 60Hz and its odd harmonics, which will be due to magnetic interference from the power transformer, are higher in the right channel (red trace), perhaps because that channel's circuits are closer to the transformer—but none of the spuriae are anywhere close to high enough to approach audibility.
Fig.3 Pass Labs INT-60, spectrum of 1kHz sinewave, DC–1kHz, at 1W into 8 ohms (linear frequency scale).
Fig.4 Pass Labs INT-60, THD+N (%) vs 1kHz continuous output power into 8 ohms.
Fig.5 Pass Labs INT-60, THD+N (%) vs 1kHz continuous output power into 4 ohms.
Fig.6 Pass Labs INT-60, THD+N (%) vs 1kHz continuous output power into 2 ohms.
The Pass Labs was less comfortable driving 2 ohms than it was with higher impedances, as shown by fig.7, which plots the percentage of THD+N against frequency into 8, 4, and 2 ohms at a fairly high level, 12.65V, equivalent to 20W into 8 ohms, 40W into 4 ohms, and 80W into 2 ohms. Note that with the limited amount of negative feedback used, the distortion rises in the upper octaves—although, as high-level content above 10kHz is very rare in music, this decreasing linearity shouldn't affect sound quality.
Fig.7 Pass Labs INT-60, THD+N (%) vs frequency at 12.65V into: 8 ohms (left channel blue, right red), 4 ohms (left cyan, right magenta), 2 ohms (left, gray).
Fig.8 Pass Labs INT-60, spectrum of 50Hz sinewave, DC–1kHz, at 20W into 8 ohms (linear frequency scale).
Fig.9 Pass Labs INT-60, 1kHz waveform at 20W into 8 ohms, 0.08% THD+N (blue); distortion and noise waveform with fundamental notched out (red, not to scale).
Fig.10 Pass Labs INT-60, spectrum of 1kHz sinewave, DC–1kHz, at 20W into 8 ohms (linear frequency scale).
Fig.11 Pass Labs INT-60, HF intermodulation spectrum, DC–30kHz, 19+20kHz at 40W peak into 4 ohms (linear frequency scale).
As I have come to expect from Pass Laboratories, the INT-60 offered respectable measured performance that included a careful balance of the consequences of the limited amount of negative feedback used. I'm a little suspicious of the change from predominantly second- to third-order harmonic distortion as the frequency rises, as I feel that amplifiers that maintain a constant distortion signature sound better. However, it's as fair to concede that I have no actual evidence that that is true in this case as it is to note that Herb Reichert loved the INT-60's sound.—John Atkinson


