Sidebar 3: Measurements
I used DRA Labs' MLSSA system and a calibrated DPA 4006 microphone to measure the PMC fact.8 signature's farfield behavior. I left the grille off for the measurements. PMC specifies the fact.8's sensitivity as 89dB/W/m; my estimated sensitivity was within experimental error of the specification, at 88.5dB(B)/2.83V/m. The fact.8's nominal impedance is specified as 8 ohms, which the solid trace in fig.1 indicates is appropriate, the impedance remaining above 8 ohms for much of the audioband. The minimum values are 5.47 ohms between 185Hz and 200Hz and 5.15 ohms at 11.3kHz. Although the electrical phase angle (dashed trace) is high at some frequencies, the impedance magnitude is also high at those frequencies. The fact.8 signature will be easy to drive.

 Although PMC describes the fact.8's woofers as being loaded with an "Advanced Transmission Line," the solid trace in fig.1 doesn't look significantly different from the impedance of a conventional reflex loading, with a low-frequency saddle at what would be the tuning frequency of the port. I investigated further by examining the nearfield step responses of the woofers and the vent at the end of the line. As with a reflex design, the output of the port is in opposite polarity to that of the woofers, though the length of the line delays the vent output by several milliseconds.
The red trace in fig.3 shows the frequency-domain behavior of the PMC's vent. It does have a peak close to the frequency of the saddle in the impedance magnitude plot, but there is also a higher-level peak centered on 110Hz, the frequency of one of the wrinkles in the impedance traces. There is also a slight suckout at this frequency in the nearfield output of the woofers (fig.3, blue trace), and the woofers do have a minimum-motion notch at what appears to be the tuning frequency of the vent, 32Hz. (This is where the cones are held stationary by the back pressure from the reflex port resonance.) This graph was taken with the LF control set to "0." The "–1" and "–2" settings, respectively, reduce the level of the woofers by 2dB and 4dB between 70Hz and 200Hz and by up to 5dB and 10dB below 70Hz.
Although PMC describes the fact.8's woofers as being loaded with an "Advanced Transmission Line," the solid trace in fig.1 doesn't look significantly different from the impedance of a conventional reflex loading, with a low-frequency saddle at what would be the tuning frequency of the port. I investigated further by examining the nearfield step responses of the woofers and the vent at the end of the line. As with a reflex design, the output of the port is in opposite polarity to that of the woofers, though the length of the line delays the vent output by several milliseconds.
The red trace in fig.3 shows the frequency-domain behavior of the PMC's vent. It does have a peak close to the frequency of the saddle in the impedance magnitude plot, but there is also a higher-level peak centered on 110Hz, the frequency of one of the wrinkles in the impedance traces. There is also a slight suckout at this frequency in the nearfield output of the woofers (fig.3, blue trace), and the woofers do have a minimum-motion notch at what appears to be the tuning frequency of the vent, 32Hz. (This is where the cones are held stationary by the back pressure from the reflex port resonance.) This graph was taken with the LF control set to "0." The "–1" and "–2" settings, respectively, reduce the level of the woofers by 2dB and 4dB between 70Hz and 200Hz and by up to 5dB and 10dB below 70Hz.
 The output of the woofers—both behave identically—is relatively even in the midrange, and it crosses over to the tweeter (green trace) at the specified 1.7kHz. The tweeter's response appears to be a little too low in level for the first octave of its passband, which might relate to KR feeling that the fact.8 was less sensitive than the specified figure. This graph was taken with the HF control set to its center position. Setting it to "+1" increased the tweeter's output level by 1dB above 6kHz; setting the control to "–1" reduced the output above 6kHz by 1dB.
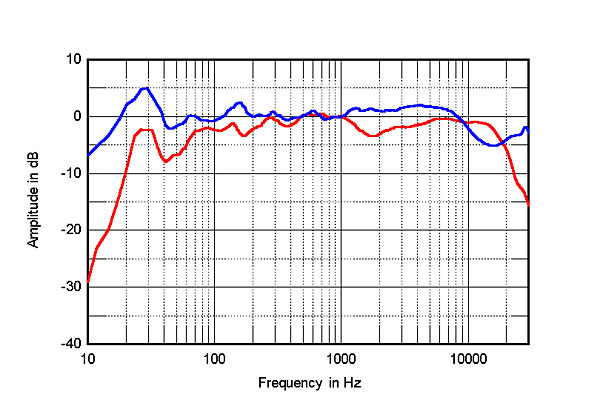
I left both controls set to "0" when I examined the fact.8's farfield response, averaged across a 30° horizontal window centered on the tweeter axis (fig.4, black trace above 300Hz). A slight lack of energy between 1.5kHz and 6kHz is evident in this graph, along with a similarly slight excess of energy in the top octave. The black trace below 300Hz in fig.4 shows the sum of the PMC's nearfield woofer and vent outputs, taking into account acoustic phase and the different distance of each radiator from a nominal farfield microphone position. The usual excess of upper-bass energy due to the nearfield measurement technique, which assumes that the radiators are mounted on a true infinite baffle, ie, one that extends indefinitely in both horizontal and vertical planes, is absent. Instead, there appears to be a lack of upper-bass energy, which might correlate with KR's describing the fact.8 as having a "reduced contribution in the upper bass and low midrange." More on this aspect of the fact.8's behavior later.
The output of the woofers—both behave identically—is relatively even in the midrange, and it crosses over to the tweeter (green trace) at the specified 1.7kHz. The tweeter's response appears to be a little too low in level for the first octave of its passband, which might relate to KR feeling that the fact.8 was less sensitive than the specified figure. This graph was taken with the HF control set to its center position. Setting it to "+1" increased the tweeter's output level by 1dB above 6kHz; setting the control to "–1" reduced the output above 6kHz by 1dB.
I left both controls set to "0" when I examined the fact.8's farfield response, averaged across a 30° horizontal window centered on the tweeter axis (fig.4, black trace above 300Hz). A slight lack of energy between 1.5kHz and 6kHz is evident in this graph, along with a similarly slight excess of energy in the top octave. The black trace below 300Hz in fig.4 shows the sum of the PMC's nearfield woofer and vent outputs, taking into account acoustic phase and the different distance of each radiator from a nominal farfield microphone position. The usual excess of upper-bass energy due to the nearfield measurement technique, which assumes that the radiators are mounted on a true infinite baffle, ie, one that extends indefinitely in both horizontal and vertical planes, is absent. Instead, there appears to be a lack of upper-bass energy, which might correlate with KR's describing the fact.8 as having a "reduced contribution in the upper bass and low midrange." More on this aspect of the fact.8's behavior later.
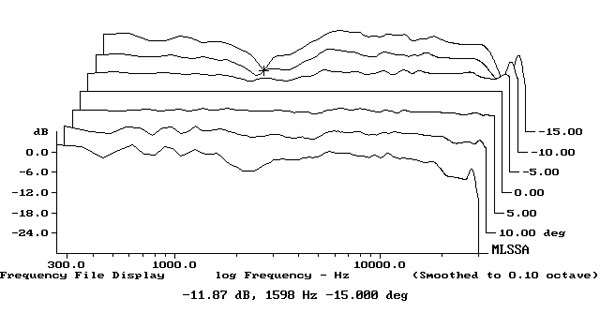
 The plot of the fact.8's horizontal dispersion, referenced to the response on the tweeter axis (fig.5), indicates that the speaker's output drops off to the sides above 10kHz. This will tend to balance some of the on-axis top-octave excess in medium-sized and large rooms. In addition, some of the missing presence-region energy on the on-axis response reappears off-axis. The contour lines in this graph are otherwise relatively even throughout the midrange and treble, which correlates with stable stereo imaging. In the vertical plane (fig.6), a suckout develops in the crossover region 15° above the tweeter axis, but the speaker's response hardly changes over a ±5° window centered on the tweeter axis, which is 38.5" from the floor.

 The red trace in fig.7 shows the PMCs' spatially averaged response in my room with the level controls set to "0." (This trace is generated by averaging 20 spectra, taken for the left and right speakers individually using a 96kHz sample rate, in a vertical rectangular grid 36" wide by 18" high and centered on the position of my ears.) For reference, the blue trace shows the spatially averaged response of the Vimberg Mino speakers that I reviewed in the April 2020 issue of Stereophile, when placed in the same positions, well away from room boundaries. Although I usually use 1/6-octave smoothing for my in-room measurements, at Jim Austin's suggestion I used 1/3-octave smoothing in this case, to make the differences in the response trends easier to see.
 Interpreting the PMC fact.8s' in-room behavior is going to be very dependent on the music being played. If with one recording the listener perceives the level of the upper midrange as being correct, then the lower midrange and low frequencies are going to sound a little lacking in warmth, and the mid-treble is going to sound rather uninvolving. Conversely, if the levels of the lower midrange and presence region are perceived as being correct, the upper midrange is going to sound somewhat forward but also very detailed. Although it wasn't possible for me to perform a set of spatially averaged measurements in KR's room, I think they do explain his auditioning comments.
In the time domain, the fact.8's step response on the tweeter axis (fig.8) indicates that the tweeter and woofers are all connected in positive acoustic polarity. The decay of the tweeter's step doesn't quite blend smoothly with the start of the woofer's step, which suggests that the optimal axis is slightly below the tweeter axis. It is fair to note, however, that the vertical dispersion graph (fig.6) indicates that the frequency response doesn't change between the tweeter axis and an axis 5° lower. The PMC's cumulative spectral-decay plot (fig.9) is impressively clean, though the excess of energy in the up- per midrange is associated with some low-level delayed energy. (Ignore the small ridge just below 17kHz, which is due to interference from the computer monitor's line-scan frequency.)
Interpreting the PMC fact.8s' in-room behavior is going to be very dependent on the music being played. If with one recording the listener perceives the level of the upper midrange as being correct, then the lower midrange and low frequencies are going to sound a little lacking in warmth, and the mid-treble is going to sound rather uninvolving. Conversely, if the levels of the lower midrange and presence region are perceived as being correct, the upper midrange is going to sound somewhat forward but also very detailed. Although it wasn't possible for me to perform a set of spatially averaged measurements in KR's room, I think they do explain his auditioning comments.
In the time domain, the fact.8's step response on the tweeter axis (fig.8) indicates that the tweeter and woofers are all connected in positive acoustic polarity. The decay of the tweeter's step doesn't quite blend smoothly with the start of the woofer's step, which suggests that the optimal axis is slightly below the tweeter axis. It is fair to note, however, that the vertical dispersion graph (fig.6) indicates that the frequency response doesn't change between the tweeter axis and an axis 5° lower. The PMC's cumulative spectral-decay plot (fig.9) is impressively clean, though the excess of energy in the up- per midrange is associated with some low-level delayed energy. (Ignore the small ridge just below 17kHz, which is due to interference from the computer monitor's line-scan frequency.)
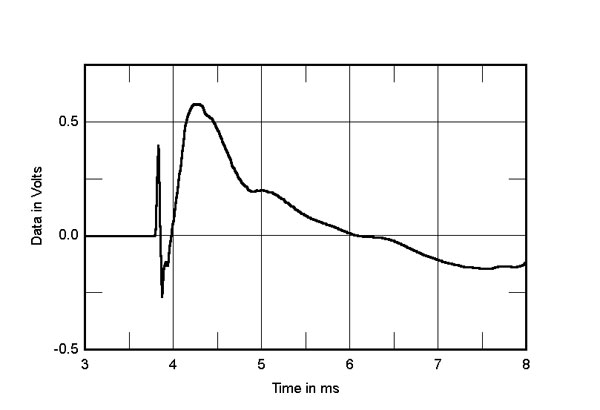

Fig.1 PMC fact.8 signature, electrical impedance (solid) and phase (dashed) (2 ohms/vertical div.).
Although there are some wrinkles in the impedance traces between 100Hz and 400Hz, the enclosure seemed inert, perhaps due to the complicated internal panels that form the transmission line that loads the woofers. When I examined the vibrational behavior of the cabinet walls with a plastic-tape accelerometer, the only resonant modes I found were both high in frequency and low in level (fig.2). The cabinet is commendably quiet.
Fig.2 PMC fact.8 signature, cumulative spectral-decay plot calculated from output of accelerometer fastened to center of front baffle (MLS driving voltage to speaker, 7.55V; measurement bandwidth, 2kHz).
Fig.3 PMC fact.8 signature, acoustic crossover on tweeter axis at 50", corrected for microphone response, with the nearfield responses of the woofer (blue) and ventt (red), respectively plotted below 350Hz and 480Hz.
Fig.4 PMC fact.8 signature, anechoic response on tweeter axis at 50", averaged across 30° horizontal window and corrected for microphone response, with the complex sum of the nearfield woofer and vent responses plotted below 300Hz.
Fig.5 PMC fact.8 signature, lateral response family at 50", normalized to response on tweeter axis, from back to front: differences in response 90–5° off axis, reference response, differences in response 5–90° off axis.
Fig.6 PMC fact.8 signature, vertical response family at 50", normalized to response on tweeter axis, from back to front: differences in response 15–5° above axis, reference response, differences in response 5–15° below axis.
Fig.7 PMC fact.8 signature, spatially averaged, 1/3-octave response in JA's listening room (red) and of the Vimberg Mino (blue).
With loudspeakers that have nonflat responses, the question is at what frequency to make their outputs equal, in order to compensate for their different sensitivities. I decided to normalize the in-room responses of the PMCs and Vimbergs at 1kHz. The Vimberg Minos have a relatively even in-room response, though with a slight excess of energy between 1 and 8kHz. By contrast, the PMC fact.8s' in-room response is shelved down in the lower midrange and bass and has significantly less presence-region energy. While the Minos' sloped-down response above 6kHz is mainly due to the increased absorptivity of the room's furnishings in this region, the fact.8s have up to 4dB greater output in the top audio octave.
Fig.8 PMC fact.8 signature, step response on tweeter axis at 50" (5ms time window, 30kHz bandwidth).
Fig.9 PMC fact.8 signature, cumulative spectral-decay plot on tweeter axis at 50" (0.15ms risetime).
The PMC fact.8 signature's measurements do correlate with the sonic character Kal reported, I feel.—John Atkinson